US Gasoline Inventories Support Gasoline, Crude Oil Futures
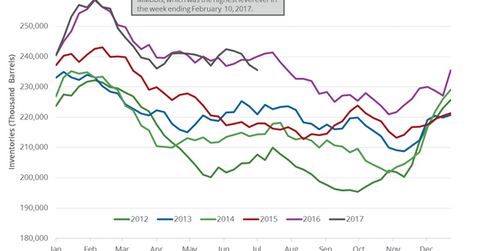
The EIA reported that US gasoline inventories fell 1.6 MMbbls (million barrels) to 235.6 MMbbls between June 30, 2017, and July 7, 2017.
July 13 2017, Updated 11:05 a.m. ET

US gasoline inventories
The EIA (U.S. Energy Information Administration) reported that US gasoline inventories fell 1.6 MMbbls (million barrels) to 235.6 MMbbls between June 30, 2017, and July 7, 2017. US gasoline inventories fell 0.70% week-over-week and 10.7% year-over-year.
US gasoline futures rose 0.20% to $1.52 per gallon on July 12, 2017. Likewise, US crude oil (ERY) (FENY) (IXC) prices rose 1.0% and closed at $45.49 per barrel on the same day. US gasoline and crude oil prices rose due to the larger-than-expected fall in gasoline and crude oil inventories.
Higher gasoline and crude oil prices have a positive impact on oil producers and refiners such as Cobalt International Energy (CIE), Western Refining (WNR), Marathon Petroleum (MPC), Chesapeake Energy (CHK), and Continental Resources (CLR).
US gasoline production, imports, and demand
US gasoline production rose 104,000 bpd (barrels per day) to 10.4 MMbpd (million barrels per day) between June 30, 2017, and July 7, 2017. Production rose 1.0% week-over-week and 2.5% year-over-year.
US gasoline imports rose 211,000 bpd to 528,000 bpd between June 30, 2017, and July 7, 2017. Imports fell 28.5% week-over-week and 35.6% year-over-year.
US gasoline demand rose 81,000 bpd to 9.8 MMbpd between June 30, 2017, and July 7, 2017. Demand rose 0.80% week-over-week and 1.2% year-over-year.
Impact of gasoline inventories
US gasoline inventories fell for the fourth straight week. They have fallen 6.7 MMbbls, or 3.0%, in those four weeks. Gasoline demand is usually higher during the summer season. The expectation of record gasoline demand this summer could support gasoline and crude oil (RYE) (BNO) prices.
In the next part of this series, we’ll take a look at US distillate inventories and production between June 30, 2017, and July 7, 2017.
