Is US Gasoline Demand Turning Bearish?
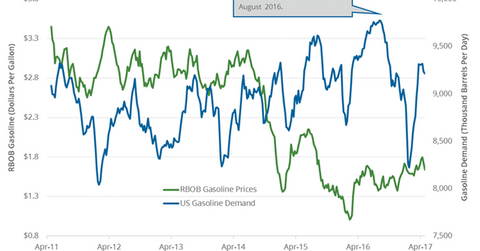
The EIA estimated that four-week average US gasoline demand fell by 22,000 bpd (barrels per day) to 9,215,000 bpd on April 21–28, 2017.
May 10 2017, Published 10:12 a.m. ET

US gasoline demand
The EIA (U.S. Energy Information Administration) estimated that four-week average US gasoline demand fell by 22,000 bpd (barrels per day) to 9,215,000 bpd on April 21–28, 2017. US gasoline demand fell 0.2% week-over-week and 3% year-over-year. The fall in gasoline demand is bearish for gasoline and crude oil (FENY) (USL) (USO) prices. For more on crude oil prices, read Part 1 and Part 2 of this series.
Lower gasoline and crude oil (XLE) (UCO) (DIG) prices have a negative impact on refiners and oil producers’ earnings like Phillips 66 (PSX), Valero Energy (VLO), Warren Resources (WRES), and Triangle Petroleum (TPLM).
Gasoline prices
US gasoline prices hit $1.14 per gallon on March 15, 2016—the lowest price in 12 years. As of May 9, 2017, prices have risen 31% from their lows in March 2016 due to the increase in gasoline demand. Rising gasoline demand partially supported crude oil prices as well. US crude oil prices have risen ~77% during the same period. Changes in gasoline demand drive gasoline inventories. For updates on gasoline inventories, read the previous part of the series.
US gasoline consumption estimates for 2017 and 2018
The EIA released its monthly STEO (Short-Term Energy Outlook) report on May 9, 2017. It estimates that US gasoline consumption will average 9,330,000 bpd and 9,360,000 bpd in 2017 and 2018, respectively. US gasoline consumption figures for 2018 will be the highest ever. US gasoline consumption averaged 9,330,000 bpd and 9,180,000 bpd in 2016 and 2015, respectively. US gasoline consumption hit a record in 2016. High gasoline consumption in 2017 and 2018 could support gasoline and crude oil prices.
In the last part of this series, we’ll take a look at some crude oil price forecasts.
