September US Gasoline Consumption Hits Record for This Time of Year
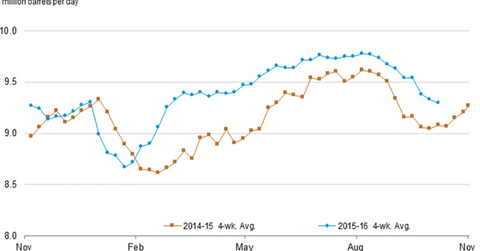
The EIA reported that the four-week average US gasoline demand fell by 36,000 bpd (barrels per day) to 9,296,000 bpd between September 30 and October 7, 2016.
Nov. 20 2020, Updated 1:16 p.m. ET

US gasoline consumption 
The EIA (U.S. Energy Information Administration) reported that the four-week average US gasoline demand fell by 36,000 bpd (barrels per day) to 9,296,000 bpd between September 30 and October 7, 2016. US gasoline demand fell 0.4% week-over-week, but rose 2.3% year-over-year.
The EIA released its monthly STEO (Short-Term Energy Outlook) report on October 13, 2016. It reported that gasoline consumption hit a record in September 2016 for this time of the year. Consumption rose due to the increase in highway travels. Drivers traveled more due to lower gasoline prices and improvement in the labor market.
US gasoline prices hit a low of $1.14 per gallon on February 8, 2016, the lowest in 12 years. As of October 18, 2016, prices were up 32% from the lows in February 2016 due to the increase in gasoline demand.
Rising demand supported crude oil prices as well. Crude oil prices rose ~92% for the same period. For more on crude prices, read part one of this series.
US gasoline consumption estimates for 2016 and 2017 
The EIA reported that US gasoline consumption will average 9,340,000 bpd (barrels per day) in 2016 and 9,390,000 bpd in 2017, respectively. This would be the highest annual average gasoline consumption figure on record for both years. US gasoline consumption averaged 9,180,000 bpd and 8,920,000 bpd in 2015 and 2014, respectively.
High gasoline consumption should support gasoline and crude oil prices. High gasoline and crude oil prices could have a positive impact on the earnings of refiners and oil producers like Valero Energy (VLO), Northern Oil & Gas (NOG), Tesoro (TSO), and Northern Tier Energy (NTI).
Moves in crude oil and gasoline prices also impact funds such as the VelocityShares 3x Long Crude Oil ETN (UWTI), the United States Gasoline Fund (UGA), the SPDR S&P Oil & Gas Equipment & Services ETF (XES), the Vanguard Energy ETF (VDE), and the PowerShares DWA Energy Momentum ETF (PXI).
Read Are Global Supply Outages Bullish or Bearish for Crude Oil Market, How Asia’s Crude Oil Demand Could Support Crude Oil Prices, and Monthly US Crude Oil Production: Lowest Level since May 2014 for more bullish drivers.
Read Major Banks Downgrade Crude Oil Prices despite OPEC’s Deal and Will Crude Oil Prices Test 3 Digits Again? to learn about crude oil price forecasts.
For ongoing analysis, visit Market Realist’s Upstream Oil and Gas page.
