Last Week’s Top MLP Gainers
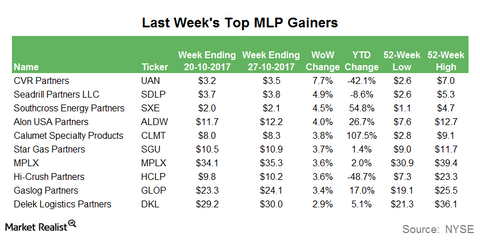
CVR Partners (UAN), the MLP mainly involved in the production of nitrogen fertilizers, was the top MLP gainer last week. CVR Partners rose 7.7%.
Oct. 31 2017, Published 3:42 p.m. ET

CVR Partners
CVR Partners (UAN), the MLP mainly involved in the production of nitrogen fertilizers, was the top MLP gainer last week. CVR Partners rose 7.7%. Its recent gains could be due to the strengthening of ammonia prices. However, the partnership has lost 42.1% since the beginning of this year.
Seadrill Partners
Seadrill Partners (SDLP), the MLP formed by Seadrill Limited (SDRL) to own and operate offshore drilling rigs, was the second-highest MLP gainer last week. SDLP rose 4.9% during the week. The partnership has lost 8.6% in 2017 to date. Last week, SDLP announced a flat distribution of $0.1 per unit for the third quarter.
Southcross Energy Partners
Southcross Energy Partners (SXE), the midstream MLP mainly involved in natural gas gathering and processing, natural gas compression, NGLs fractionation, and NGLs transportation, was the third-highest MLP gainer last week. SXE rose 4.5% last week. SXE has risen 54.8% YTD (year-to-date). However, the partnership is still trading significantly below the levels before the rout in energy prices.
Alon USA Partners
Alon USA Partners (ALDW), the MLP involved in crude oil refining and marketing, was the fourth-highest MLP gainer last week. ALDW, which is owned by Delek US Holdings (DK), rose 4.0% during the week. ALDW has risen 26.7% in 2017 to date.
