How Volatile Are Natural Gas and Crude Oil?
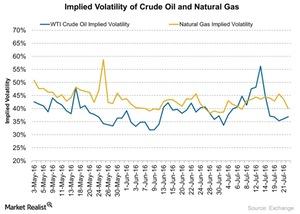
Natural gas’s (UNG) (GASL) (GASX) implied volatility was 40.0% on July 22, 2016. Its 15-day average implied volatility is 42.5%.
July 25 2016, Published 9:38 a.m. ET

Crude oil’s implied volatility
Crude oil’s (USO) (OIIL) implied volatility was 36.93% on July 22, 2016. Its 15-day average implied volatility is 41.1%. This means that crude oil’s current implied volatility is 10.1% below its 15-day average.
Crude oil’s implied volatility spiked to 56.3% on July 13, 2016. Since then, its implied volatility has fallen by 34.40%. From July 13 to date, the US crude oil contract for September delivery has fallen by 2.9%. Between July 15 and July 22, US crude oil fell by 5.3%. Its implied volatility fell 17.9% between July 15 and July 28.
What about natural gas?
Natural gas’s (UNG) (GASL) (GASX) implied volatility was 40.0% on July 22, 2016. Its 15-day average implied volatility is 42.5%. This means that natural gas’s current level of implied volatility is 5.9% below its 15-day average.
Natural gas’s implied volatility spiked to 58.7% on May 24, 2016. Since then, its implied volatility has fallen by 31.8%. Since May 24, natural gas has risen by 48.5%. Last week, natural gas September futures rose by 0.55%.
Energy stocks
This analysis could be important for upstream oil and gas stocks such as Abraxas Petroleum (AXAS), Triangle Petroleum (TPLM), Gulfport Energy (GPOR), WPX Energy (WPX), and Comstock Resources (CRK). It also important for natural gas tracking ETFs such as the ProShares Ultra Bloomberg Natural Gas (BOIL), the Direxion Daily Natural Gas Related Bear 3X ETF (GASX), the United States Natural Gas ETF (UNG), and the Direxion Daily Natural Gas Related Bull 3X ETF (GASL). It impacts crude oil tracking ETFs such as the United States Oil ETF (USO) and the Credit Suisse X-Links WTI Crude ETF (OIIL).
In the next part of this series, we’ll look at some key macroeconomic indicators for crude oil.
