US Natural Gas Production and Consumption Could Impact Prices
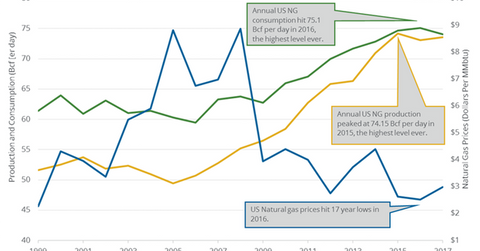
According to PointLogic, US dry natural gas production increased by 0.3 Bcf (billion cubic feet) per day to 75.7 Bcf per day on January 11–17, 2018.
Jan. 22 2018, Published 8:47 a.m. ET

Weekly US natural gas production
According to PointLogic, US dry natural gas production increased by 0.3 Bcf (billion cubic feet) per day to 75.7 Bcf per day on January 11–17, 2018. Production increased 0.4% week-over-week and 8.1% or by 5.7 Bcf per day YoY (year-year-year).
Natural gas prices (UNG) (DGAZ) fell ~12.8% in the last 12 months—partially due to excess supply. Reuters estimates that dry gas production in the lower 48 states of the US could rise this week. Any rise in production is bearish for natural gas (UGAZ) prices.
Weekly US natural gas consumption
US natural gas consumption fell 0.3% to 102.3 Bcf per day on January 11–17, 2018. However, consumption increased 26% from a year ago. The YoY increase in gas consumption is bullish for natural gas (FCG) (UNG) prices.
It benefits energy producers’ (FENY) (FXN) earnings like WPX Energy (WPX), Southwestern Energy (SWN), Gulfport Energy (GPOR), and Ultra Petroleum (UPL).
Meanwhile, Reuters estimates that US natural gas consumption could fall this week. Any decline in consumption is bearish for natural gas (DGAZ) (BOIL) prices.
Estimates
The EIA estimates that US dry natural gas production averaged a record 78.1 Bcf per day in December 2017. It also estimates that US natural gas production could average ~80.42 Bcf per day in 2018. US natural gas consumption could average ~77.53 Bcf per day in 2018. Production and consumption are expected to hit a new record in 2018.
