US Gasoline Demand Is Significant for Crude Oil Bulls
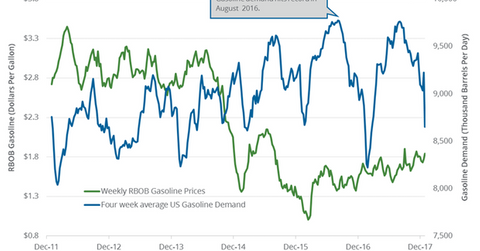
According to the EIA, US gasoline demand fell by 835,000 bpd (barrels per day) or 8.8% to 8,650,000 bpd on December 22–29, 2017.
Jan. 10 2018, Published 8:28 a.m. ET

Weekly US gasoline demand
According to the EIA, US gasoline demand fell by 835,000 bpd (barrels per day) or 8.8% to 8,650,000 bpd on December 22–29, 2017. However, demand rose by 185,000 bpd or 2.2% from the same period in 2016.
The year-over-year increase in gasoline demand is bullish for gasoline (UGA) and oil (UWT) (OIL) prices. Higher gasoline prices benefit US refiners (CRAK) like CVR Energy (CVI) and Marathon Petroleum (MPC).
Crude oil (SCO) prices are at the highest level since December 2014. Oil companies (IEZ) (PXI) like W&T Offshore (WTI), Stone Energy (SGY), and Gastar Exploration (GST) benefit from higher oil (DBO) prices.
US gasoline demand peak and low
US gasoline prices and gasoline demand are usually closely related, as you can see in the above chart. US gasoline demand tested 9,776,000 bpd in August 2016—the highest level ever. In contrast, demand tested 8,222,000 bpd in January 2017—the lowest level since February 2012.
US gasoline consumption estimates
US gasoline consumption averaged 9,180,000 bpd in 2015 and 9,320,000 bpd in 2016. Consumption hit a record in 2016. US gasoline consumption averaged 9,300,000 bpd in 2017.
The EIA released its monthly STEO (Short-Term Energy Outlook) report on January 9, 2018. The EIA forecast that US gasoline consumption will average 9,330,000 bpd in 2018—0.3% higher than 2017. US gasoline consumption will average 9,390,000 bpd in 2019—0.6% higher than 2018.
