US Gasoline’s Demand Trend Is Changing
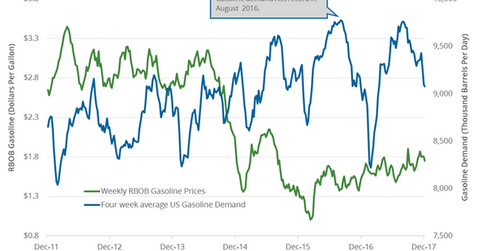
The EIA estimates that four-week average US gasoline demand fell by 21,000 bpd (barrels per day) to 9.1 MMbpd on December 1–8, 2017.
Dec. 19 2017, Published 9:12 a.m. ET

US gasoline demand
The EIA estimates that four-week average US gasoline demand fell by 21,000 bpd (barrels per day) to 9.1 MMbpd (million barrels per day) on December 1–8, 2017. However, demand rose 1.6% or by 142,000 bpd YoY (year-over-year).
The YoY increase in gasoline demand will benefit gasoline and crude oil (USL) (SCO) prices. Higher gasoline (UGA) prices have a positive impact on US refiners (CRAK) like Phillips 66 (PSX) and Valero (VLO).
US gasoline demand peaks and lows
The above chart shows the relationship between gasoline demand and gasoline prices. US gasoline demand hit 8.2 MMbpd in January 2017. It was the lowest level since February 2012. US gasoline demand hit 9.8 MMbpd in August 2016—the highest level ever.
US gasoline consumption estimates
On December 12, 2017, the EIA released its STEO (Short-Term Energy Outlook) report. It estimates that US gasoline consumption will average 9.34 MMbpd in 2018. It would be the highest level ever. Higher demand would be positive for oil prices. Higher oil (UWT) prices have a positive impact on oil producers (XES) (PXI) like Stone Energy (SGY) and Northern Oil & Gas (NOG).
US gasoline consumption could average 9.32 MMbpd in 2017. Consumption averaged 9.32 MMbpd in 2016—a record high.
Impact
US gasoline consumption could hit a record in 2018. Record gasoline demand is bullish for gasoline and even crude oil (UWT) (DBO) prices. However, improving fuel efficiency could have a marginal impact on gasoline consumption.
Next, we’ll discuss some crude oil price forecasts.
