How Crude and Natural Gas Rig Counts Affected Natural Gas Prices
The US natural gas rig count rose by two to 118 rigs between November 18 and November 23, 2016.
Nov. 20 2020, Updated 11:38 a.m. ET
Weekly US natural gas rig count  
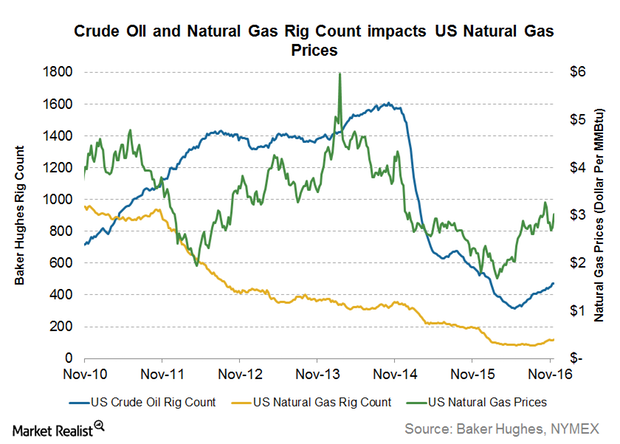
Baker Hughes (BHI) will release the US natural gas rig count report on December 2, 2016. The US natural gas rig count rose by two to 118 rigs between November 18 and November 23, 2016. The US natural gas rig count rose 1.7% week-over-week but fell 37.6% year-over-year.
US natural gas prices rose 23.4% year-to-date. For more on natural gas prices, read part one and part two of this series. Higher natural gas prices have a positive impact on drilling activity.
Peaks and lows in natural gas rigs 
The US natural gas rig count peaked at 1,606 rigs on September 12, 2008. On the other hand, it hit a low of 81 rigs in the week ending August 26, 2016, a 92.8% fall from its peak level.
US natural gas drilling activity fell due to lower natural gas prices, while natural gas prices fell due to oversupply. However, natural gas production has been strong despite lower natural gas prices due to booming crude oil production. Natural gas is often an associated product of crude oil. Read US Crude Oil Production Rose for the Second Straight Week for more on US crude oil production.
US crude oil and natural gas drilling activity will likely continue to rise due to Donald Trump’s victory. Read Rig Count Could Impact US Crude Oil Production and Prices for more on the US crude oil rig count. The rise in drilling could mean higher production, which could eventually push prices lower.
Meanwhile, the rise in the drilling activity has a positive impact on oil drillers such as Diamond Offshore (DO), Atwood Oceanics (ATW), Halliburton (HAL), and Rowan Companies (RDC). Read Who Wins in the Energy Subsectors after the US Election Results? to learn more.
EIA’s monthly drilling report 
The EIA (U.S. Energy Information Administration) estimates that US natural gas production will fall in the seven shale regions by 94 million cubic feet per day to 46,951 million cubic feet per day in December 2016 compared to the previous month. Production is expected to fall mainly in the Eagle Ford and Niobrara Shale regions during the same period.
Monthly international rig count
Baker Hughes’s international oil rig count, which excludes data from the US and Canada, showed that international oil rigs rose by six rigs to 684 for September 2016 compared to the previous month. The count rose 0.9% month-over-month. However, it fell by 187 rigs, or 21.5%, YoY.
Impact on ETFs  
The ups and downs in crude oil and natural gas prices can impact funds such as the Direxion Daily Natural Gas Related Bull 3X ETF (GASL), the PowerShares DWA Energy Momentum ETF (PXI), the SPDR S&P Oil & Gas Exploration & Production ETF (XOP), the ProShares UltraShort Bloomberg Crude Oil ETF (SCO), the iShares Global Energy ETF (IXC), the United States Natural Gas ETF (UNG), and the VelocityShares 3x Inverse Natural Gas ETN (DGAZ).
Read the next part of the series to learn more about US natural gas production.