Silver Wheaton Corp
Latest Silver Wheaton Corp News and Updates
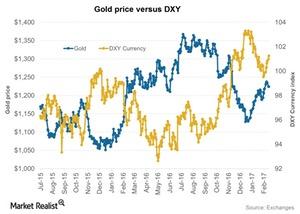
How the Dollar’s Revival Is Impacting Precious Metals in May
The US Dollar Index, which prices the dollar against a basket of six major world currencies, has risen ~0.46% on a trailing-five-day basis.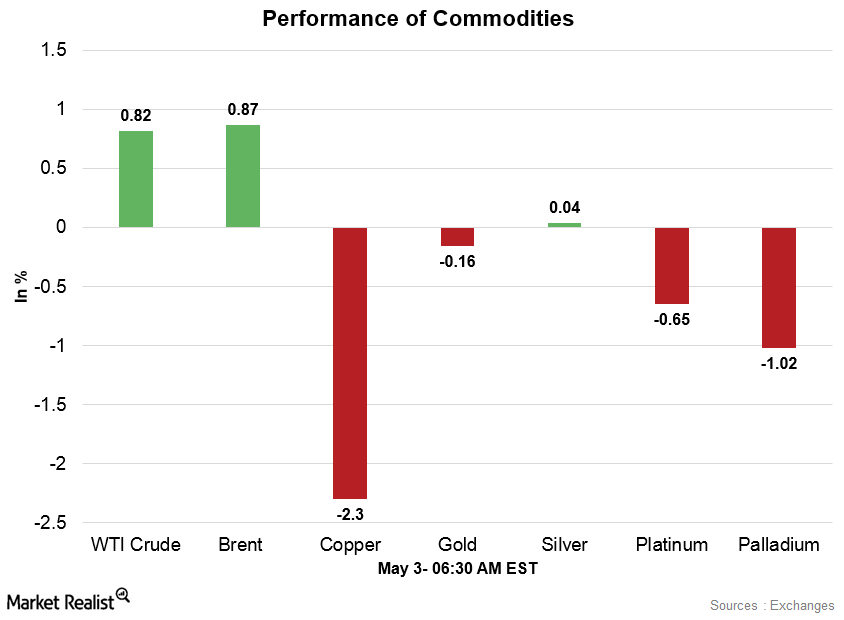
Crude Oil Is Stable amid Lower Inventory Levels
After falling to five-week low price levels on May 2, crude oil prices are stable in the early hours on May 3. The market opened higher on Wednesday.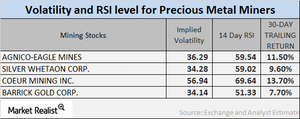
Reading the Mining Stocks’ Falling RSI Numbers
Newmont Mining, Silver Wheaton, Randgold, and Yamana have RSI levels of 45.5, 37.1, 41.2, and 43.0, respectively.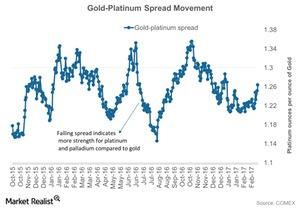
Platinum Is the Worst Performer So Far—Reading Its Spread
The gold-platinum spread was ~1.3 on April 26, 2017. The gold-platinum spread RSI on that day was 59.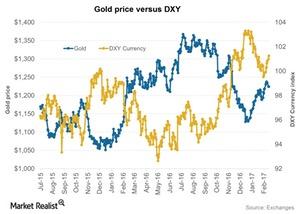
Gauging the Role of the US Dollar in the April 19 Fall of Precious Metals
Another important phenomenon that played on the fall of precious metals on Wednesday, April 19, was the upswing of the US dollar.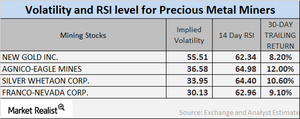
Analyzing the Volatility of Mining Stocks
As of April 6, 2017, the volatilities of New Gold (NGD), Agnico Eagle (AEM), Silver Wheaton (SLW), and Franco-Nevada (FNV) were 55.5%, 36.6%, 34%, and 30.1%, respectively.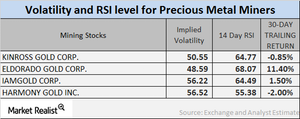
How Are Mining Stocks Performing at the Start of April 2017?
As of April 4, 2017, the volatilities of New Gold (NGD), Agnico Eagle Mines (AEM), Silver Wheaton (SLW), and Randgold Resources (GOLD) were 51.5%, 35.4%, 61.7%, and 54.1%, respectively.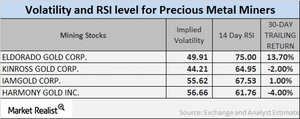
Understanding Mining Stock Volatility in March
Now that mining companies have begun witnessing revivals from their losses earlier this year, it becomes crucial to examine the volatility figures and RSI.
Analyzing the Correlation between Silver Prices and Miners
Mining funds such as the iShares MSCI Global Gold Min (RING) and the leveraged ProShares Ultra Gold (AGQ) have also seen significant correlations with their respective precious metals.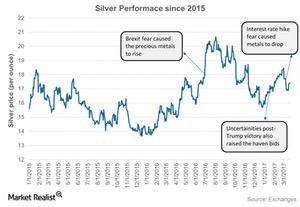
These Factors Have Been Driving Silver Prices
Silver has performed slightly better than gold and platinum on a year-to-date basis.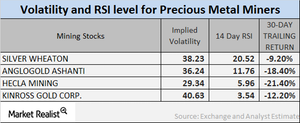
Analyzing Mining Stocks’ Volatility
As of March 15, the volatilities of Silver Wheaton, AngloGold Ashanti, Hecla Mining, and Kinross Gold were 38.2%, 36.2%, 29.3%, and 40.6%, respectively.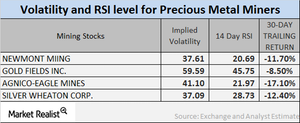
Are Miners Rebounding from Last Week’s Slump?
Monitoring the implied volatilities of large mining stocks is important. We should also watch their RSI (relative strength index) levels, particularly in the wake of changing precious metals prices.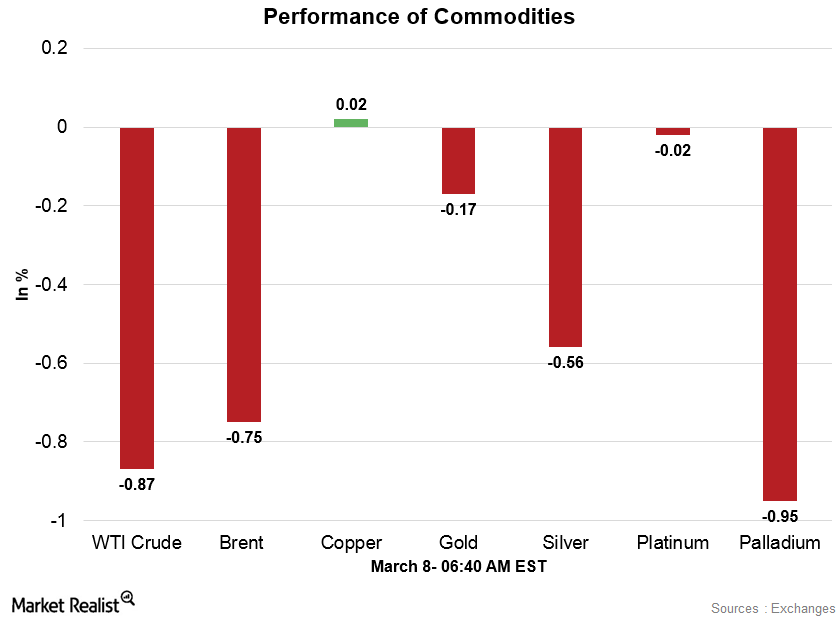
Commodities Are Weaker amid the Firmer Dollar
Gold (GLD) and silver (SLW) are weaker in the early hours due to the firmer dollar and expectations of a US interest rate hike in the Fed’s March meeting.
Mining Stocks: An Upward or Downward Correlation to Gold?
Agnico-Eagle Mines has the highest correlation to gold year-to-date. Primero Mining is the least correlated to gold.
Mining Stocks and Gold Prices: Reading the Correlation
It’s important to understand which mining stocks have overperformed and underperformed precious metals.
Inside Gold’s Upward and Downward Correlation Trends
Precious metal prices have risen due to uncertainty since Donald Trump won the US presidential election.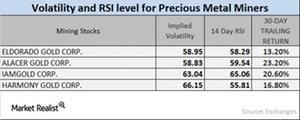
Where Are Mining Stocks’ RSI Numbers and Volatility Pointing?
The trailing 30-day returns of most mining companies are positive due to precious metals’ diminishing safe-haven appeal.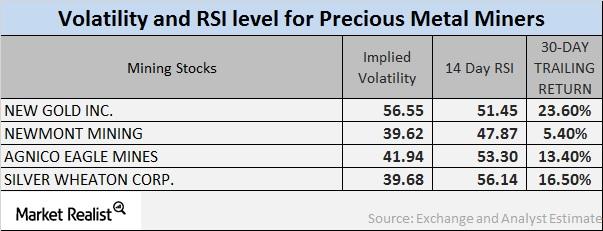
Reading the Volatility and RSI Levels for Miners
Precious metal mining stocks are known to closely track the performance of their respective precious metals. Mining stocks often show more volatility than metals.
Understanding the Correlation of Mining Stocks in 2017
Precious metal prices have been falling since Trump won the US Presidential election on November 8, 2016. Mining stocks quickly followed suit.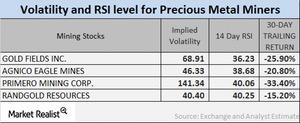
What Were Mining Stocks’ Correlations during December?
Precious metals had a great start to 2016. Franco-Nevada’s correlation rose from an ~0.59 three-year correlation to an ~0.63 one-year correlation.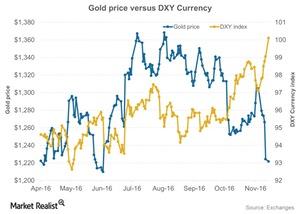
US Dollar Played on Gold in 2016
The correlation between gold and the US Dollar Index is -0.36. It means that about 36.0% of the time, gold and the dollar move in opposite directions.
Analyzing Upward and Downward Correlations among Miners
Precious metals had a great start to 2016, but they’ve been falling since Donald Trump won the US presidential election. As a result, mining stocks have also been falling.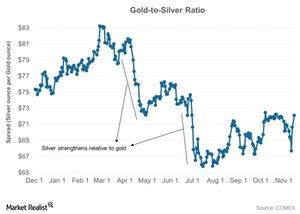
How Has the Gold-Silver Ratio Trended in 2016?
Gold and silver have been strong for the past few days. However, silver has substantially outperformed gold year-to-date.
Which Mining Stock Is Most Correlated to Gold?
Mining companies that have high correlations with gold include Sibanye Gold (SBGL), Gold Fields (GFI), Silver Wheaton (SLW), and Franco-Nevada (FNV).
What Do Mining Stocks’ Technicals Indicate?
Many of the fluctuations in precious metals have been a result of speculation about the Federal Reserve’s interest rate stance.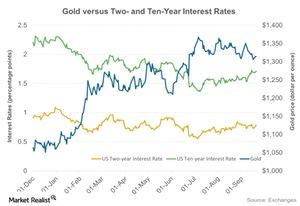
Fed’s Hawkish Stance: Why It Impacted Precious Metals
Last week was rough for precious metals. Gold, silver, platinum, and palladium all fell. Gold had the biggest weekly fall in about three years.Macroeconomic Analysis How Has the US Dollar Affected Platinum Prices?
The current weakness in the rand made it fall to all-time lows against the US dollar in early 2016 but has helped mining companies.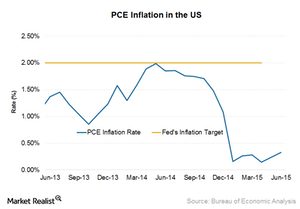
Could PCE Inflation Inspire Action at the Next Fed Meeting?
The BEA released the PCE inflation index for June on August 3, 2015. PCE inflation rose 0.30%—a pace that hasn’t been seen since December 2014.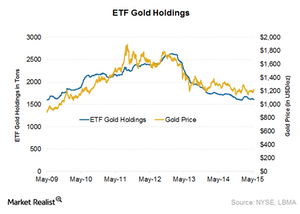
Gold ETF Holdings Fall to 4-Month Low Led by the SPDR Gold Trust
Gold ETF holdings reached a peak of 1,679.8 tons on February 24. In January and early February, gold holdings surged because of the Swiss National Bank’s decision to remove the euro cap.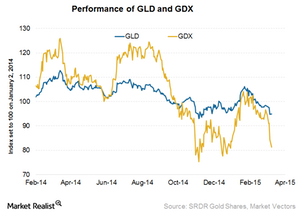
Key Indicators Impacting Gold Price Performance
Gold prices are holding steady in April. The SPDR Gold Trust ETF traded at $115.43 on April 15, almost flat when compared with April 1’s value of $115.60.
