
Teresa Cederholm
Disclosure: I am in full compliance with all ethics and other policies for Market Realist research analysts. I am not invested in securities that I cover on Market Realist.
More From Teresa Cederholm
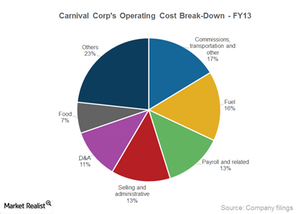
A key overview of Carnival’s costs and profitability
Carnival’s operating profit increased to $1,792 million in 2014, from $1,352 million in 2013. Its operating margin increased to 11.3%, from 8.7% in 2013.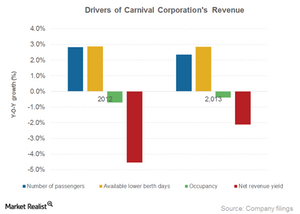
Key drivers of Carnival’s revenue growth
The growth of demand was the key driver of Carnival Corporation’s revenue growth in 2014. The number of passengers increased by 5% in 2014.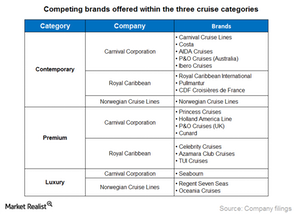
Carnival’s contemporary, premium, and luxury cruises
Cruise categories Cruise liners have been successfully providing a wide range of products and services at various price points to suit preferences of passengers from different age groups. Service levels and pricing differ by brand, category of the ship, cabins, season, duration, and itinerary. We can categorize cruise brands into these three categories: contemporary, premium, […]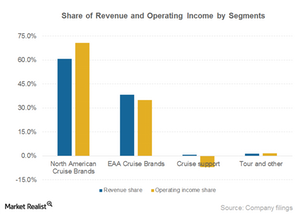
Two segments make up 98% of Carnival Corporation’s revenue
Two of Carnival Corporation’s (CCL) operating segments comprise almost 98% of the company’s revenue. Carnival also reports a Cruise Support segment and a Tour segment.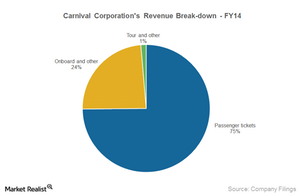
What are Carnival Corporation’s revenue sources?
Carnival Corporation (CCL) derives revenue from the following three sources: passenger tickets, onboard or other activities, and tours.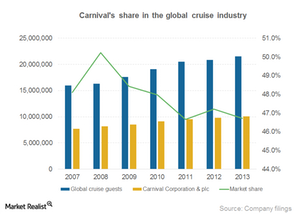
Carnival boasts largest market share of cruise passengers
The number of Carnival’s cruise passengers has increased at a six-year CAGR of 4.6%. It has the largest market share of cruise passengers at ~47%.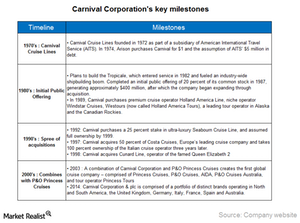
A key overview of Carnival, the world’s largest cruise company
Carnival Corporation (CCL), the largest cruise company in the world, operates 101 cruise ships and has a global market share of ~47%.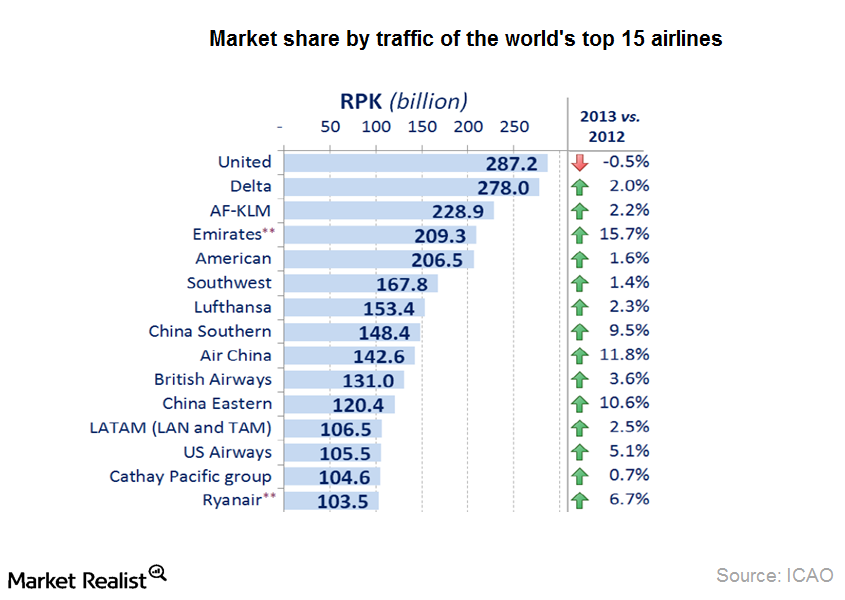
Top airlines by revenue passenger kilometers
Five US airlines are among the top 15 airlines by passenger traffic in 2013. United Continental Holdings ranks first with 287.2 billion revenue passenger kilometers.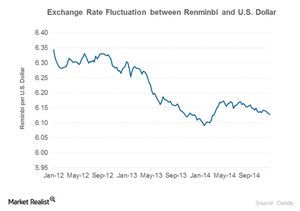
Impact of currency fluctuation on China Eastern’s profitability
Chinese companies are vulnerable to exchange rate fluctuations, especially against the US dollar, and they have a high amount of debt denominated in US dollars.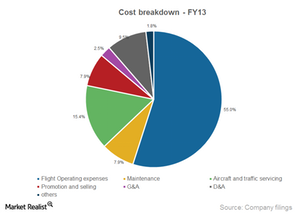
China Eastern’s operating margin declines due to rising costs
Rising costs impacted China Eastern’s (CEA) operating margins, which declined from 5% in FY09 to 1.8% in FY13.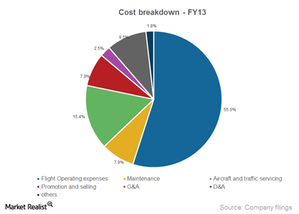
Rising operating expenses as a percentage of revenue
More than half of China Southern’s total operating expenses in FY13 were related to flight operating expenses.
China Southern one of Chinese aviation industry’s Big 3 players
The global financial crisis in 2008 hit China’s airline industry after it enjoyed double-digit growth in passenger traffic for more than a decade.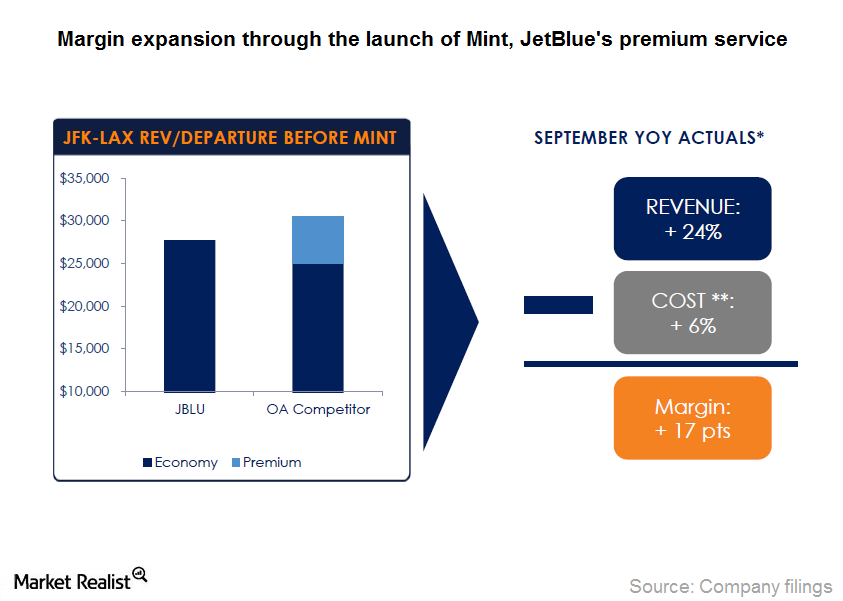
Even More drives JetBlue’s ancillary revenue
Revenue from JetBlues’ Even More Space grew at a five-year compounded annual growth rate of ~30% from $45 million in fiscal year 2008 to $170 million in fiscal year 2013.Macroeconomic Analysis Freight, passenger index values show rising transportation demand
Although trucking is the most widely used mode of transportation, the fastest growing mode of transport is by air.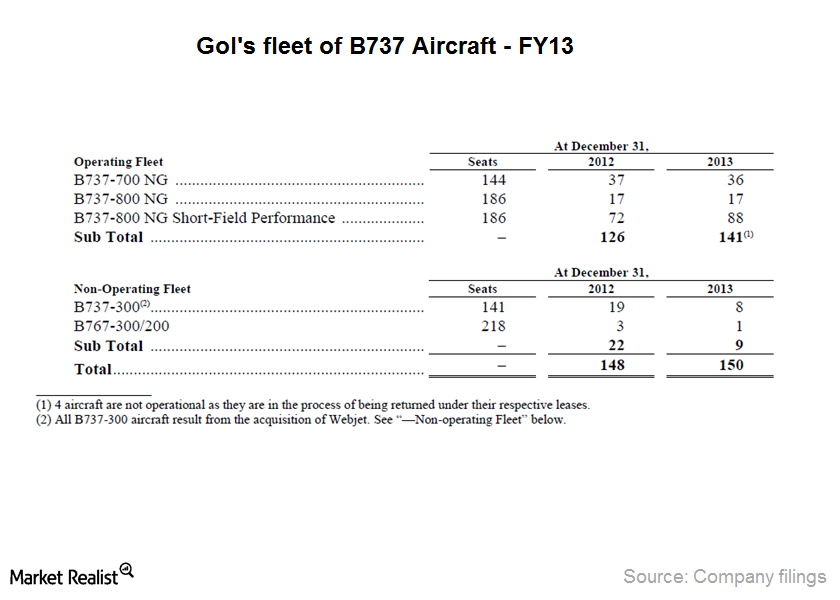
Gol maintains low-cost advantage with single fleet type
Using a single aircraft type reduces disruption of operations due to maintenance efficiencies. The airline reduces training costs with standardized pilot training and maintenance routines.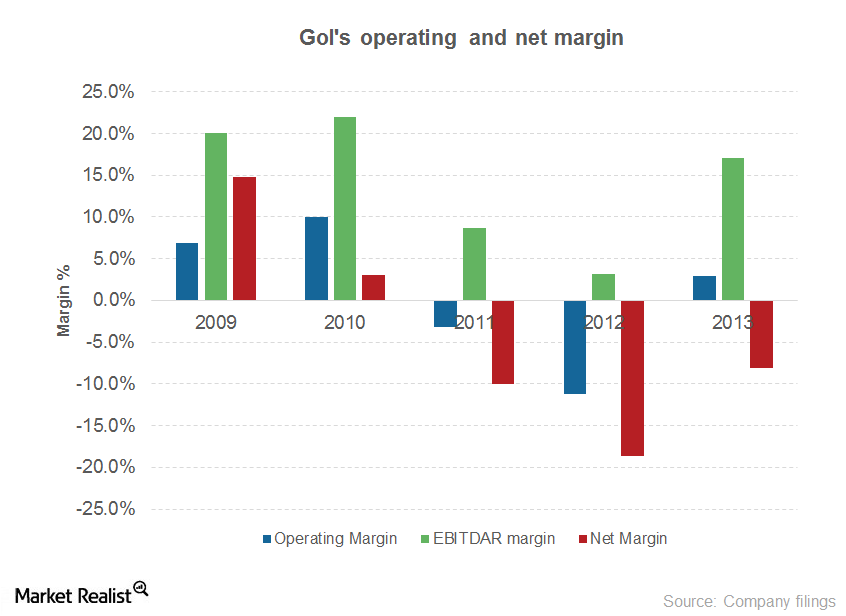
Non-operating expenses eclipse Gol’s operating profitability
Gol’s operating income turned positive in FY13 after reporting losses for two consecutive years.Industrials Must-know: SARS’ impact on the airline industry
SARS was another disease outbreak in 2003. SARS caused a panic similar to the current Ebola outbreak. SARS was a viral respiratory illness.Consumer Why Marriott’s hotels have a specific ownership structure
Marriott (MAR) operated a total of 3,916 hotel properties in fiscal year 2013. Most of these properties were either managed, franchised, or licensed.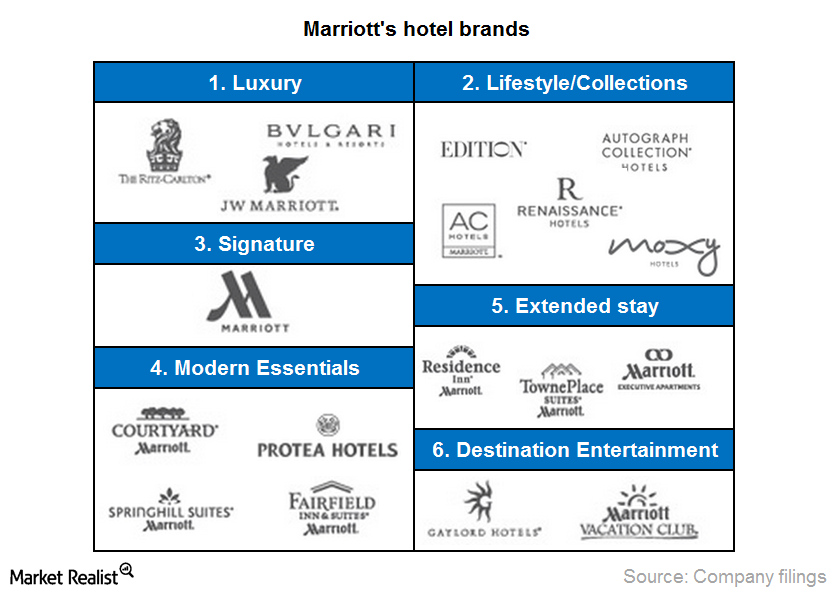
Why it’s important to understand Marriott’s brands
Marriott has a diverse portfolio of 18 brands. It describes the brands as “individually distinct and collectively powerful.”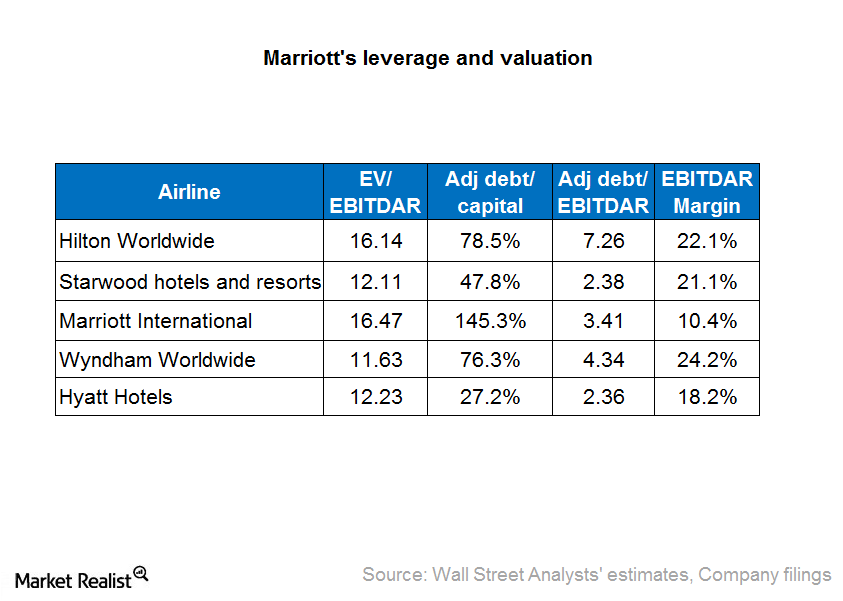
Why the EV/EBITDAR multiple is best for valuing hotel companies
The EV to EBITDAR multiple is used in businesses where there’s significant rental and lease expenses—hotels and airlines. We’ve used this to analyze Marriott’s valuation.Consumer Understanding Hilton’s operating cost
Hilton has operating expenses related to its owned and leased hotels and timeshare properties. This is separate from depreciation and amortization expenses.Consumer Key revenue drivers for the hotel industry
RevPAR is calculated by dividing hotel room revenue by the total available room nights. It’s used in the hotel industry to measure the company’s ability to generate greater revenue from each room.Consumer Must-know: Hilton gets revenue from its timeshare segment
Timesharing—also known as vacation ownership—is a method of getting the right to use a vacation property like a hotel or a resort. The buyer owns “timeshare interests” or intervals.Consumer A breakdown of Hilton’s revenue by segments
Timeshare revenue accounted for ~18% of total revenue from segments. The company generates revenue by marketing and selling timeshare interests and managing resort operations.Consumer Why Hilton expanded its presence in the international market
Hilton’s hotels, resorts, and timeshare properties are spread across 91 countries and territories. On December 31, 2013, Hilton’s portfolio consisted of 678,630 rooms.Consumer Hilton’s market share in the domestic and international market
Hilton’s growth plans are measured by the number of rooms under construction. Its growth plans rank first in the industry in all its markets—domestic and international.Industrials The global airline market’s key revenue drivers and profitability
According to IATA (or the International Air Transport Association), the global airline industry passenger volume and capacity increased by 5.3% year-over-year in July 2014. Freight volume increased by 5.8%. In July load factor (or capacity utilization) for passengers was 82.3%, and for freight, it was 44.4%.Industrials Why investors should track labor costs in the airline industry
The second largest cost component for airlines is salaries, wages, and benefits. Employment in the U.S. airline industry has increased in the last couple of years when the U.S. economy recovered from the recession and demand for air travel picked up.Industrials Must-know: Why yield is another key driver for airline revenue
Yield is the average fare per passenger per mile. Passenger revenue is calculated by multiplying RPM (or revenue passenger miles) with yield. Yield varies based on demand and supply factors. Since demand for air travel is seasonal, yield is higher during peak seasons.Industrials Must-know: Why airlines should improve their load factor
Load factor is a measure of capacity utilization. It indicates the percentage of total capacity that is utilized by an airline. Since airlines are capital intensive and have high fixed costs, the efficiency with which they utilize their assets is key to generate adequate return on investment.Industrials Must-know: Why available seat miles affect airlines’ revenue
Available seat miles (or ASM) is the measure of airline capacity. It’s calculated as the total number of seats multiplied by the total distance travelled. While RPM (or revenue passenger miles) is a measure of demand, ASM is the measure of supply.Industrials Must-know: Trends in key economic indicators that impact airlines
The airline industry is an important contributor to the U.S. economy’s growth. According to Airlines for America (or A4A), the industry drives $1.5 trillion in U.S. economic activity and more than 11 million in U.S. jobs.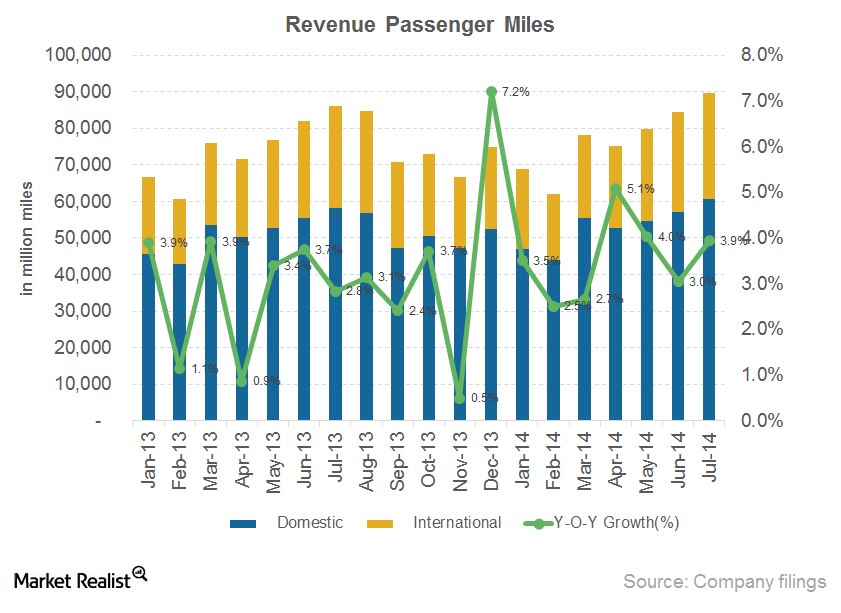
Must-know: Key indicators impacting airline industry performance
Cyclical industries follow the business cycle, so their revenues are higher during economic prosperity and lower during economic contraction. The airline industry is sensitive to changes in economic growth.Industrials Must-know: Environmental awareness in the airline industry
The global aviation industry consumes over 200 million tons of fuel per year. The rising demand for air transport and the rising crude oil prices could impact the industry’s carbon emissions. The environmental impact could also influence sustainability.Industrials Must-know: The role of technology in the airline industry
Technological advancement has been the driving factor for improving airlines’ operational efficiency. Airlines have been able to reduce costs and improve operations by using advanced aircraft engine technology, IT solutions, and mobile technology. The technology has created better connectivity and enhanced passengers’ travel experience.Industrials Travel preferences for millennials versus non-millennials
The Boston Consulting Group researched the millennial generation’s travel preferences in the business and leisure segment. This will provide a better understanding of how social and demographic factors influence air travel. It will also show how the factors influence company strategies to adopt to the changing trends.Industrials Why social and demographic factors influence air travel demand
Categorizing generations in the U.S. according to the year of birth provides insight into the changing trends in the travel and tourism industry. The demand for air travel has increased significantly over the years. Demographic factors also play an important role in forecasting demand.Industrials Why economic factors support airline industry growth
Like most industries, the airline industry is impacted by the economic cycle’s peaks and troughs. The current growth in developed economies—like U.S.—has resulted in a rise in business confidence, industrial production, and international trade.Industrials PESTEL framework analyzes the industry’s external environment
The Political, Economic, Social, Technological, Environmental, and Legal (or PESTEL) framework covers the six external factors that impact the airline industry. The framework provides a broad perspective on opportunities and threats that surround the industry. The factors can’t be controlled by the industry.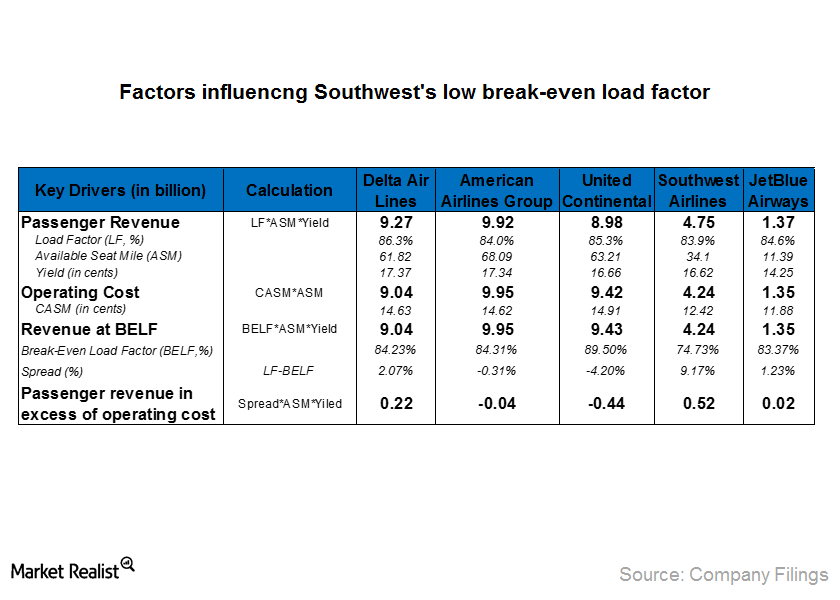
How Yield and Cost structure contribute to Southwest’s low break-even load factor?
As mentioned in the previous article, break-even load factor is calculated by dividing cost per available seat mile (or CASM) with yield per passenger mile and Southwest has the lowest break-even load factor compared to its peers. In this article we will analyze yield and cost structures of Southwest with its peers’ to determine how […]Industrials Must-know: Factors that affect aircraft utilization
Higher aircraft utilization will result in lower fixed costs per unit, as the costs spread across more air trips and passengers and results in lower cost per available seat mile.Industrials Must-know: Factors that influenced JetBlue’s top line growth
JetBlue Airways’ (JBLU) operating revenue has increased at a four-year compounded annual growth rate (or CAGR) of 13.4%, driven primarily by the growth in passenger revenue.Industrials Must-know: JetBlue’s position in key target markets
JetBlue has almost equal share in Florida, Latin America, and the transcontinental region which together accounted for about 87% of JetBlue’s total capacity.Industrials Must-know: JetBlue’s competitive airline positioning
JetBlue (JBLU) operates a hybrid business model that caters to the niche market comprising customers that it defines as “underserved customers.”Industrials An operational and financial overview of JetBlue Airways
JetBlue Airways Corporation is the fifth largest passenger carrier in the U.S. based on revenue passenger miles.Industrials Why low cost carriers influence the industry with low air fares
Over the last decade, with increasing mergers and consolidation in the U.S. airline industry and reduced competition, air fares were expected to increase dramatically.Industrials Low cost carrier strategies to maintain competitive advantage
LCCs don’t offer all services provided by a legacy carriers like free meals and drinks.Industrials Must-know: Airline business models
Southwest was instrumental in revolutionizing the industry with a differentiated business model.Industrials Overview: Southwest Airlines
As of December, 2013, the passenger segment comprised 94.5% of its revenues, cargo segment 0.9%, and ancillary revenues comprised 4.6%.Industrials Must-know: Merger synergies in the US airline industry
Network synergies accounted for almost 50%–85% of the total synergy benefits in the past airline mergers.
