How Yield and Cost structure contribute to Southwest’s low break-even load factor?
As mentioned in the previous article, break-even load factor is calculated by dividing cost per available seat mile (or CASM) with yield per passenger mile and Southwest has the lowest break-even load factor compared to its peers. In this article we will analyze yield and cost structures of Southwest with its peers’ to determine how […]
Aug. 21 2014, Updated 5:00 p.m. ET

As mentioned in the previous article, break-even load factor is calculated by dividing cost per available seat mile (or CASM) with yield per passenger mile and Southwest has the lowest break-even load factor compared to its peers. In this article we will analyze yield and cost structures of Southwest with its peers’ to determine how they contribute to Southwest’s low break-even load factor.
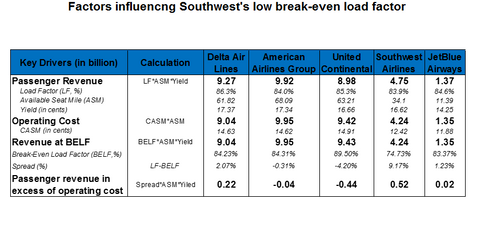
As seen in the table below, break-even load factor is the capacity at which passenger revenue will be equal to its operating cost. A positive spread between the load factor and break-even load factor contributes to excess passenger revenue over and above its operating costs. In 2Q14, Southwest’s passenger revenue in excess of operating cost was $0.52 billion, the highest among its peers.
Lower costs compared to legacy carriers
The foremost reason for Southwest’s low break-even load factor is its low-cost structure. With lower unit cost or CASM Southwest needs to sell fewer seats to break even compared to its legacy peers. Southwest’s (LUV) unit cost is 15% lower than Delta’s (DAL) and American’s (AAL) and almost 17% lower than United’s (UAL). However its CASM is 4.5% higher compared to its low cost competitor, JetBlue (JBLU). To learn more on how low-cost carriers keep costs low refer the article onLow cost carrier strategies to maintain competitive advantage. During 2Q14 Southwest’s CASM increased by 1% year-over-year to 12.42 cents primarily due to an increase in salaries, wages and benefits and acquisition and integration costs.
Yield closely comparable to legacy carriers
In addition to maintaining lower costs, Southwest’s yield (average fare per passenger per mile) is close to its legacy peers. In 2Q14 Southwest’s yield increased 6% year-over-year to 16.62 cents only around 4% lower than its legacy peers, Delta (17.37 cents) and American (17.34 cents) and very close to United’s 16.66 cents. It should be noted that Southwest’s low-cost competitor, JetBlue’s, break-even load factor was higher than Southwest’s in spite of having lower CASM because of its lower yield (14.25 cents). This explains how a combination of lower costs and higher yield contributed to Southwest’s low break-even load factor.
