Will Crude Oil Futures Rise or Fall This Week?
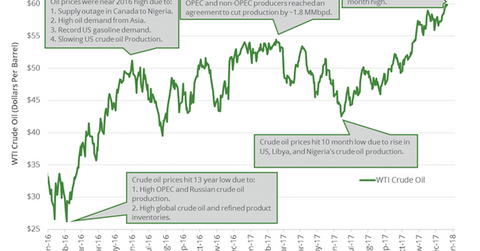
WTI crude oil (SCO) futures settled at $64.30 per barrel on January 12, 2018—the highest level since December 2014.
Nov. 20 2020, Updated 11:56 a.m. ET

Energy calendar  
The EIA will release its weekly crude oil inventory report on January 18, 2018. OPEC will release its monthly oil market report on the same day. The IEA will release its oil market report on January 19, 2018.
All of these events could influence oil (USL) prices this week. WTI oil (UWT) prices increased 4.7% last week due to several bullish drivers, which we discussed in Part 1 of this series.
WTI crude oil futures’ peak 
WTI crude oil (SCO) futures settled at $64.30 per barrel on January 12, 2018—the highest level since December 2014. The prolonging of production cuts, supply outages, and strong oil demand drove oil prices. Higher oil (USO) prices favor energy producers (XLE) (XOP) like Chevron (CVX), Baytex Energy (BTE), and Goodrich Petroleum (GDP).
Bullish drivers for crude oil futures
Higher compliance with production cuts, cold winter forecasts, fall in global oil inventories, and any supply outage will help oil prices in the coming weeks.
Hedge funds’ net long position in Brent oil futures and options are at a record level. The net long positions in WTI oil futures and options are at the highest level since 2006. It suggests that hedge funds are bullish on oil.
The difference between February 2018 WTI crude oil futures and February 2019 WTI crude oil futures was at $4.24 per barrel on January 12, 2018. It was the highest level since 2015. It suggests that prices could rise.
Bearish driver for US crude oil futures 
US crude oil production could hit new records in the coming weeks, which could cap the upside for oil (DWT) prices. Any massive rise in US gasoline inventories could also cap the upside for oil prices.
Crude oil price volatility  
The CBOE Crude Oil Volatility Index (OVX) was at 23.5 on January 12, 2018—more than a three-year low. It indicates less volatility in oil (USO) prices.
Moving averages and technical indicators 
WTI oil (USL) prices were above their 100-day, 50-day, and 20-day moving averages on January 12, 2018. It suggests prices could trend higher.
However, the relative strength index suggests that US crude oil prices are overbought. As a result, crude oil prices could fall.
Read Bears Might Control the US Natural Gas Market in 2018 for the latest updates on natural gas.
