US Crude Oil Rigs Could Impact Crude Oil Prices in 2018
Baker Hughes released its US crude oil rig count report on December 29. It reported that US crude oil rigs were flat at 747 on December 22–29, 2017.
Jan. 2 2018, Updated 12:30 p.m. ET

Crude oil rigs
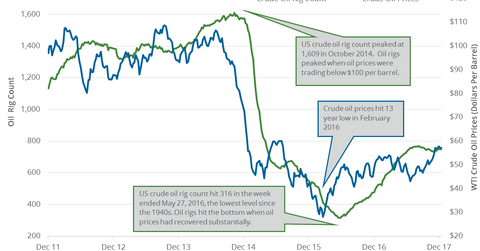
Baker Hughes, a GE company, released its US crude oil rig count report on December 29, 2017. It reported that US crude oil rigs were flat at 747 on December 22–29, 2017. The rigs were around this level in the last six weeks. However, the rigs rose 42.3% year-over-year. US crude oil (SCO) (DWT) prices rose ~12.4% in 2017. Prices were also at a mid-2015 high.
Higher oil (USL) prices benefit ETFs like the iShares U.S. Oil Equipment & Services (IEZ) and the SPDR S&P Oil & Gas Equipment & Services ETF (XES).
US crude oil rigs’ peaks and lows
US crude oil rigs hit 1,609 in October 2014—the highest level ever. In contrast, rigs tested 316 in May 2016—the lowest level since the 1940s. Rigs increased by 431 or 137% from the lows in May 2017. Energy companies (XLE) (VDE) increased their capital spending in 2017 due to the rise in oil (USO) prices.
Higher oil (UCO) prices favor oil drillers and producers like Transocean (RIG), Callon Petroleum (CPE), Parsley Energy (PE), and Diamond Offshore (DO).
Monthly drilling report
The EIA estimated that US shale oil production in the seven shale regions would increase by 94,000 bpd (barrels per day) to 6,408,000 bpd in January 2017—compared to the previous month. It will be the 13th straight increase in the US shale oil output.
Impact
US crude oil rigs rose 137% from their lows in May 2016. US crude oil production has risen 16% since July 2016. Rystad Energy estimates that US crude oil production could surpass Saudi Arabia and Russia’s crude oil production in the next 12 months. Higher oil prices would increase US oil rigs and production, which could pressure oil (DWT) prices.
Next, we’ll discuss important catalysts for crude oil prices this week.
