How the Energy Sector Performed in 2017
In this series, we’ll look at the best-performing and worst-performing stocks of the Energy Select Sector SPDR ETF (XLE) and analyze the earnings and developments behind the movements.
Jan. 25 2018, Published 1:13 p.m. ET

Crude oil, gasoline, and heating oil
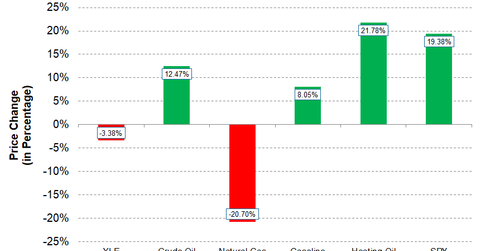
In 2017, crude oil (USO) (SCO) prices rose ~12% to $60.42 per barrel, from $53.72 at the end of 2016. In the first half of 2017, crude oil prices were on a declining trend. Crude oil prices bottomed out in June 2017 and then rose ~44% as 2017 came to the close.
Unleaded gasoline (UGA) and heating oil (UHN) increased significantly in 2017. Heating oil turned out to be the best-performing energy commodity that year. Unleaded gasoline and heating oil, which impact refining companies (CRAK), rose ~8% and ~22%, respectively, in 2017.
Natural gas fell
In 2017, natural gas (UNG) was the sole decliner in energy commodities. It decreased from the previous year’s close of $3.72 per mmBtu (million British thermal unit) on December 30, 2016, to $2.95 per mmBtu on December 29, 2017, a fall of ~21%.
Energy stocks
With mixed performances from energy commodities, the energy sector fell in 2017. The Energy Select Sector SPDR ETF (XLE), which represents an index of stocks across the energy sector, fell ~3%.
In 2017, XLE underperformed the SPDR S&P 500 ETF (SPY), which rose ~19%.
In this series
Having analyzed the performance of the broader energy sector in 2017, we’ll look at the best-performing and worst-performing stocks of the Energy Select Sector SPDR ETF (XLE) in the rest of this series. We’ll also try to analyze the earnings and any developments behind the movements in these stocks.
Let’s start with the best-performing stock in XLE for 2017.
