Crude Oil Inventories Fell, Refinery Utilization Hit 12-Year High
US crude oil futures contracts for February delivery fell 0.1% to $61.95 per barrel at 1:05 AM EST on January 5, 2018—the highest level since December 2014.
Jan. 5 2018, Updated 9:50 a.m. ET

Crude oil futures 
US crude oil futures (USO) contracts for February delivery fell 0.1% to $61.95 per barrel at 1:05 AM EST on January 5, 2018—the highest level since December 2014. Higher oil (UCO) prices benefit funds like the Guggenheim S&P Equal Weight Energy (RYE) and the Energy Select Sector SPDR Fund (XLE). These ETFs have exposure to US energy companies.
Meanwhile, E-mini S&P 500 (SPY) futures contracts for March delivery rose 0.10% to 2,726.5 at 1:05 AM EST on January 5, 2018.
US crude oil inventories 
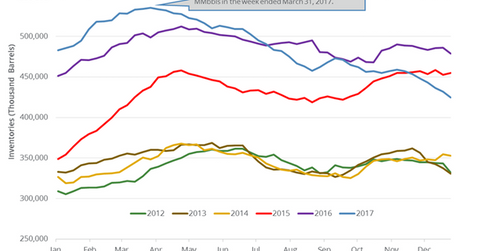
On January 4, 2018, the EIA published its Weekly Petroleum Status Report. The EIA estimated that US crude oil inventories fell by 7.4 MMbbls (million barrels) or 1.7% to 424.4 MMbbls on December 22–29, 2017. The inventories fell by 54.5 MMbbls or 11.4% from the same period in 2016.
Analysts expected that US crude oil inventories would fall by 5.2 MMbbls on December 22–29, 2017. A massive draw in US oil inventories supported oil (DBO) prices on January 4, 2018, 2017. Higher oil (USL) prices favor energy companies (IXC) (IYE) like Parsley Energy (PE), Callon Petroleum (CPE), and Occidental Petroleum (OXY).
US refinery crude oil demand and refinery utilization rates 
US refinery crude oil demand increased by 210,000 bpd (barrels per day) to 17,608,000 bpd on December 22–29, 2017. Refinery utilization rates were at 96.7% during this period—the highest level since 2005. High refinery demand and refinery utilization rates could have influenced US crude oil inventories.
Impact   
US crude oil inventories fell ~12.1% from January 6, 2017, to December 29, 2017. They also fell ~21% from their peak. US crude oil inventories could be one of the positive drivers of oil prices in 2018. US crude oil (DBO) prices rose ~12.4% in 2017. US crude oil inventories fell for the seventh consecutive week. The fall in inventories has a positive impact on oil (SCO) prices.
However, US oil inventories are 8.8% above their five-year average for the week ending December 29, 2017. It’s bearish for oil (UWT) prices. If the difference decreases, it’s a bullish sign for oil (UCO) prices.
Next, we’ll discuss an important bearish driver for crude oil prices.
