Will US Crude Oil Futures Surpass their 200-Day Moving Average?
Let’s track some important events for oil and gas traders from August 14 to 18, 2017.
Nov. 20 2020, Updated 4:21 p.m. ET

Energy calendar this week  
Let’s track some important events for oil and gas traders from August 14 to 18, 2017.
- August 15: the American Petroleum Institute will release its weekly crude oil and gasoline inventory report
- August 16: the EIA (U.S. Energy Information Administration) will release its Weekly Petroleum Status Report
- August 17: the EIA will release its weekly natural gas inventory report
- August 18: Baker Hughes will release its weekly US oil and gas rig count report
High and low 
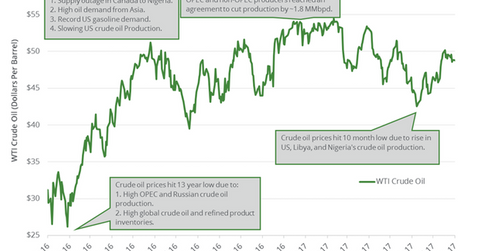
WTI (West Texas Intermediate) active crude oil (IXC)(IYE)(XOP) futures hit $26.21 per barrel on February 11, 2016—their lowest level in more than a decade. In contrast, prices hit $54.45 per barrel on February 23, 2017—their highest level in more than two years.
Crude oil futures and moving averages 
US crude oil (DIG)(OIH) prices are near a two-month high. Moves in crude oil prices impact oil and gas producers such as Bill Barrett (BBG), Chevron (CVX), and Denbury Resources (DNR).
September US crude oil futures are above their 20-day, 50-day, and 100-day moving averages as of August 11, 2017. But they’re below their 200-day moving average of $51.14 per barrel as of August 11, 2017.
Will crude oil futures rise above $50 per barrel? 
Oil traders could track these factors which could drive oil (ERY) (ERX) prices higher are:
- higher compliance by OPEC with the production cut deal in August 2017
- a fall in OPEC crude oil exports in August 2017
- a massive fall in global and US crude oil and product inventories in the coming months
Traders are skeptical about the production cut deal’s success. Read Crude Oil: Price Forecasts and Hedge Funds’ Position for more information on crude oil price forecasts.
In the next part of this series, we’ll see how Cushing crude oil inventories impact prices.
