How Encana Stock Has Performed This Year
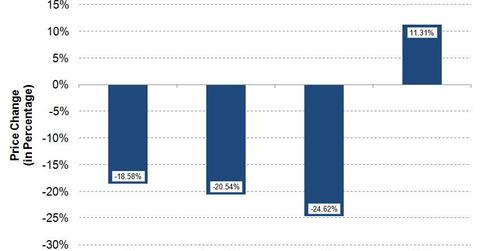
Year-to-date, Encana’s (ECA) stock has fallen ~19% to $9.53. The stock is trading below its 50-week and 200-week moving averages.
Aug. 16 2017, Updated 3:35 p.m. ET

Encana’s year-to-date stock performance
Year-to-date, Encana’s (ECA) stock has fallen ~19%, or from $11.70 to $9.53. On a weekly basis, ECA’s stock price has been making a pattern of lower highs and lower lows since the start of fiscal 2017. ECA’s stock is trading below its 50-week and 200-week moving averages. On August 14, 2017, ECA’s stock price closed at $9.53, whereas its 50-week and 200-week moving averages stand at $10.87 and $12.33, respectively. Currently, ECA’s stock price is ~12% below its 50-week moving average.
ECA is outperforming natural gas but lagging crude oil prices
Encana’s production mix contains ~60% natural gas and ~40% liquids. Thus, ECA’s stock price is sensitive to the changes in both natural gas (UNG) and crude oil (USO) prices. Since the start of fiscal 2017, natural gas prices are down ~21%. Natural gas prices fell from $3.73 per MMBtu (million British thermal units) to $2.96 per MMBtu.
Crude oil (USO) prices also fell from $53.72 per barrel to $47.59 per barrel, a decrease of almost 11% during the same period. Thus, ECA’s stock is outperforming natural gas prices but underperforming crude oil prices in fiscal 2017.
Encana’s peers
Encana primarily operates in the Eagle Ford Shale and the Permian Basin in the US, and Montney and Duvernay in Canada. EP Energy (EPE), Diamondback Energy (FANG), and Approach Resources (AREX), which also operate in the Permian Basin, are down by ~50%, ~10, and ~27% in fiscal 2017, respectively. ConocoPhillips (COP) and Murphy Oil (MUR) have operations in Montey. Year-to-date, COP and MUR are down by ~10% and ~17%, respectively.
In general, year-to-date, the natural gas (UNG) exploration and production companies (FCG) have underperformed the S&P 500 ETF (SPY) by a wide margin. FCG is down by ~25%, whereas SPY is up by ~11% in fiscal 2017. According to the SPDR S&P 500 ETF Trust prospectus, “The Trust seeks to provide investment results that, before expenses, correspond generally to the price and yield performance of the S&P 500 Index.”
Series overview
Having analyzed the year-to-date price performance of ECA stock, we’ll study ECA’s key financial details in subsequent parts. Specifically, we’ll study ECA’s earnings per share and revenues and cash flows. We’ll also take a look at ECA’s short interest, implied volatility, and Wall Street ratings.
Let’s start with ECA’s most recent earnings.
