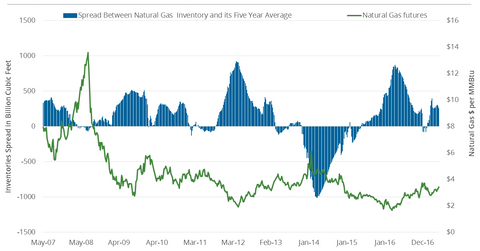
Natural Gas Inventory Spread Is Falling: Will Gas Prices Soar?
According to EIA data announced on May 18, there was an addition of 68 Bcf to natural gas (GASX) (FCG) (GASL) inventories for the week ending May 12, 2017.
May 25 2017, Published 1:23 p.m. ET

Natural gas inventory data
According to EIA (U.S. Energy Information Administration) data announced on May 18, 2017, there was an addition of 68 Bcf (billion cubic feet) to natural gas (GASX) (FCG) (GASL) inventories for the week ending May 12, 2017.
Natural gas inventories and prices
However, the spread between natural gas inventories and their five-year average is more important to natural gas prices because inventories are seasonal.
In the last decade, higher inventories compared to the five-year average led to a downturn in natural gas prices. In contrast, between December 2013 and April 2014, when inventory levels were less than the five-year average, natural gas (BOIL) prices rose to $6.14 per million British thermal units. A higher inventory spread could also explain the downturn in natural gas prices since June 2008.
Recent natural gas inventories and prices
In the week ending May 12, 2017, natural gas inventories were at 2,369 Bcf—12.1% more than the five-year average. In the 15 weeks since the spread reversed from being less than the five-year average, natural gas prices fell 2.7%.
Inventories are 13.7% lower than they were last year, which could explain why the gain has been so small. It could also ensure that prices don’t fall to the lows we saw during March 2016. Natural gas inventories stood at 2,301 Bcf, 14% more than the five-year average, in the week ending May 5, 2017.
Market estimates suggests
The EIA will announce inventory data for the week ending May 19, 2017, on May 25, 2017. Analysts project a rise of 72 Bcf in natural gas inventories. If the contraction in the inventory spread continues, natural gas prices could rise.
Natural gas prices impact ETFs like the Fidelity MSCI Energy ETF (FENY), the Direxion Daily S&P Oil & Gas Exploration & Production Bear 3x ETF (DRIP), the iShares US Energy (IYE), the ProShares Ultra Oil & Gas (DIG), the Vanguard Energy ETF (VDE), and the SPDR S&P Oil & Gas Exploration & Production ETF (XOP).
