Analyzing US Crude Oil Inventories by Region: The Latest
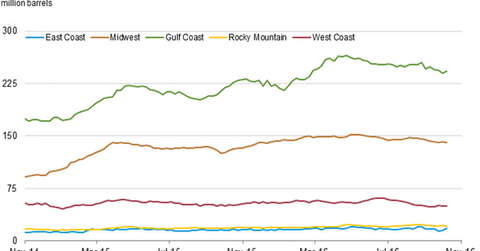
The EIA divides the United States into five storage regions. Let’s assess the changes in crude oil inventories for these regions between September 30 and October 7.
Oct. 14 2016, Published 3:06 p.m. ET

US crude oil inventories by region
The EIA divides the United States into five storage regions. Let’s assess the changes in crude oil inventories for these regions between September 30 and October 7.
- East Coast: a rise of 3.1 MMbbls to 18.3 MMbbls
- Midwest: a fall of 1 MMbbls to 141.1 MMbbls
- Gulf Coast: a rise of 3 MMbbls to 242.9 MMbbls
- Rocky Mountain: a fall of 0.6 MMbbls to 21.5 MMbbls
- West Coast: a rise of 0.4 MMbbls to 50.1 MMbbls
Impact of US crude oil inventories
US crude oil inventories hit an all-time high of 543.6 MMbbls in the week ending April 29, 2016. Since then, they’ve fallen 13% from all-time highs.
The decrease in inventories could support crude oil prices. High crude oil prices could have a positive impact on oil and gas producers’ earnings, including Warren Resources (WRES), Comstock Resources (CRK), and Stone Energy (SGY).
The ups and downs in crude oil prices impact ETFs such as the Energy Select Sector SPDR (XLE), the ProShares Ultra Bloomberg Crude Oil ETF (UCO), the ProShares Ultra Oil & Gas (DIG), the SPDR S&P Oil & Gas Exploration & Production ETF (XOP), and the SPDR S&P Oil & Gas Equipment & Services ETF (XES).
In the next part of this series, we’ll take a look at US crude oil production.
