What’s the Long-Term US Natural Gas Price Forecast?
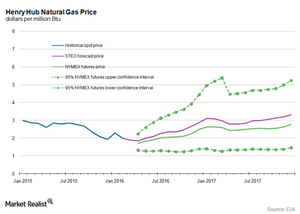
In its March Short-Term Energy Outlook report, the EIA forecast that the US natural gas supply-demand balance could average around 2.9 Bcf per day in 2016.
Nov. 20 2020, Updated 3:45 p.m. ET

Supply and demand balance 
In its March Short-Term Energy Outlook report, the EIA (U.S. Energy Information Administration) forecast that the US natural gas supply-demand balance could average around 2.9 Bcf (billion cubic feet) per day in 2016. The supply-demand balance could rise to 4.1 Bcf per day in 2017. The US natural gas stockpiles are 52% more than their five-year average. They’re also at the highest level in the last five years during this period of the year. The high inventory and rising supply and demand gap could limit the upside for natural gas prices over the long term.
EIA’s natural gas price forecasts  
The EIA forecast that US natural gas prices could average $2.25 per MMBtu (British thermal units in millions) in 2016 and $3.02 per MMBtu in 2017. Goldman Sachs (GS) estimates that natural gas prices will trade around $3.10 per MMBtu in 2016 and $3.80 per MMBtu in 2017. Moody’s forecast that natural gas prices could average $2.25 per MMBtu in 2016 and $2.5 per MMBtu in 2017. Raymond James, a financial services firm, forecast that US natural gas prices could average around $2 per MMBtu in 2016.
The roller coaster ride in natural gas prices impacts ETFs and ETNs such as the Guggenheim S&P 500 Equal Weight Energy ETF (RYE), the VelocityShares 3x Long Natural Gas ETN (UGAZ), the Fidelity MSCI Energy ETF (FENY), and the PowerShares DWA Energy Momentum Portfolio (PXI).
The ups and downs in natural gas prices impact natural gas producers like Anadarko Petroleum (APC), Comstock Resources (CRK), Southwestern Energy (SWN), Vanguard Natural Resources (VNR), and Memorial Resource Development (MRD).
For related analysis, check out Market Realist’s Energy and Power page.
