Guggenheim S&P 500® Pure Growth ETF
Latest Guggenheim S&P 500® Pure Growth ETF News and Updates
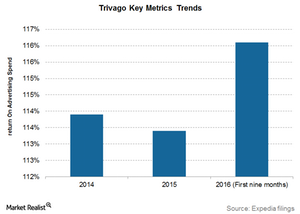
Analyzing Trivago’s Key Metrics
RQPR rose 2.1% in 2015 to 1.5 euros compared to 1.4 euros in 2014. For the nine months ended in September 2016, RQPR fell 6.0%.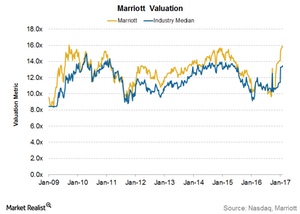
What Are Investors Willing to Pay for Marriott International?
Marriott (MAR) currently trades at a forward EV-to-EBITDA multiple of 15.8x. Its valuation has been significantly higher than its average valuation.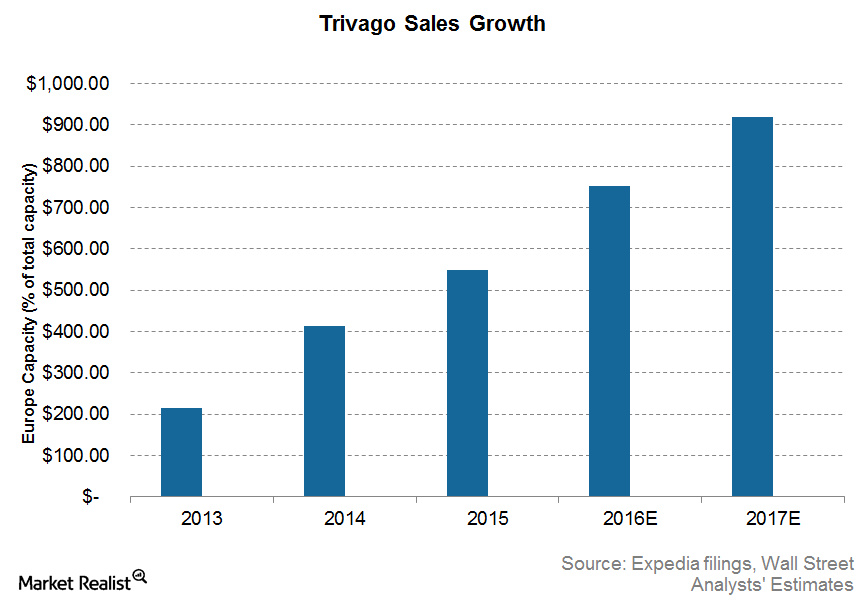
Trivago Commercials Find a Huge Audience
Trivago spends a great deal of money on its popular ads. Three of its ads rank among the top ten most-watched travel videos on YouTube for 2016.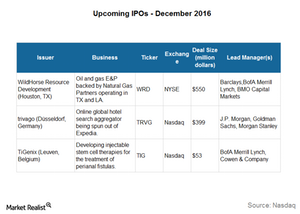
Trivago’s Expected IPO on December 16
Trivago, Expedia’s (EXPE) German hotel booking site, filed for an IPO in the US on November 14, 2016. The expected date for the Trivago IPO is Friday, December 16.
Analyzing Trivago’s Financials: Revenue at the Cost of Ads
Trivago’s revenue has risen an impressive 90.0% CAGR from 2010 to 2013. As Trivago’s markets mature, the growth rate will decline, as is evident from recent trends.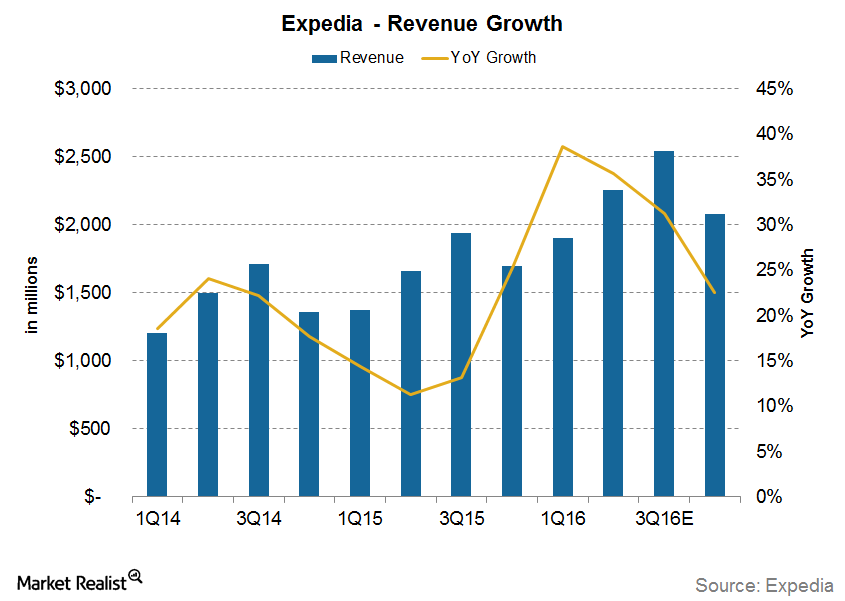
Can Expedia Continue Its Revenue Growth in 2016?
For 3Q16, analysts are estimating Expedia’s (EXPE) revenue to rise 31.3%. That’s slightly lower than the growth in the first and second quarters.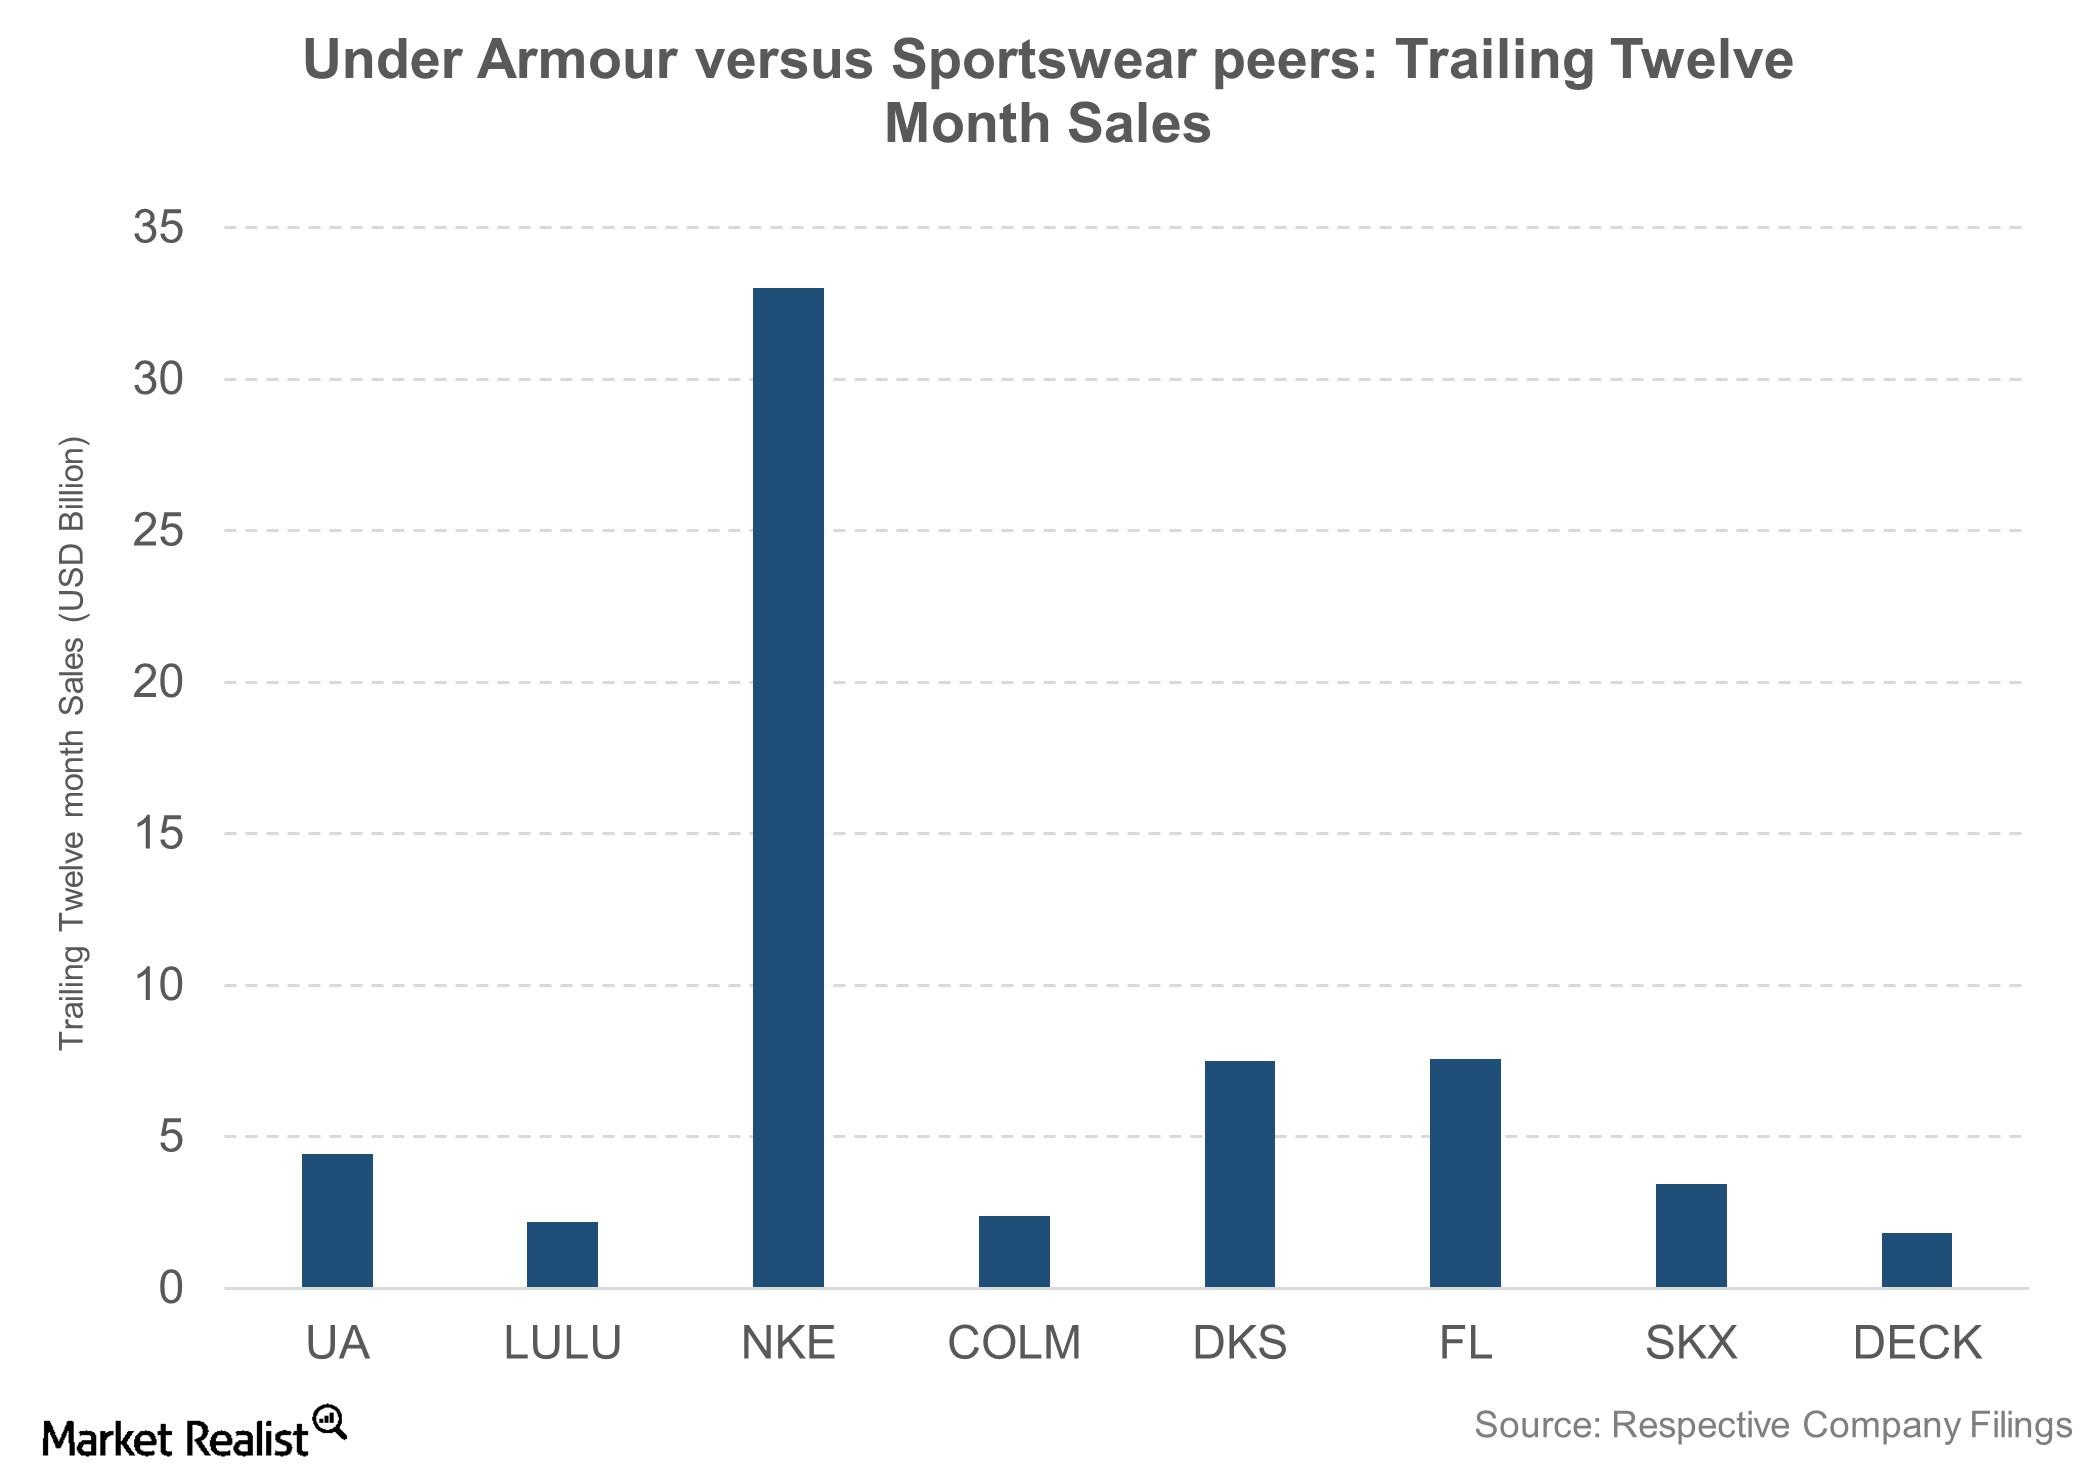
Nike May Have Jordan, but Under Armour Boasts Phenom Curry
Although it’s a relatively new player in the sportswear industry, Under Armour has given tough competition to industry pioneers such as Nike (NKE) and Adidas (ADDYY).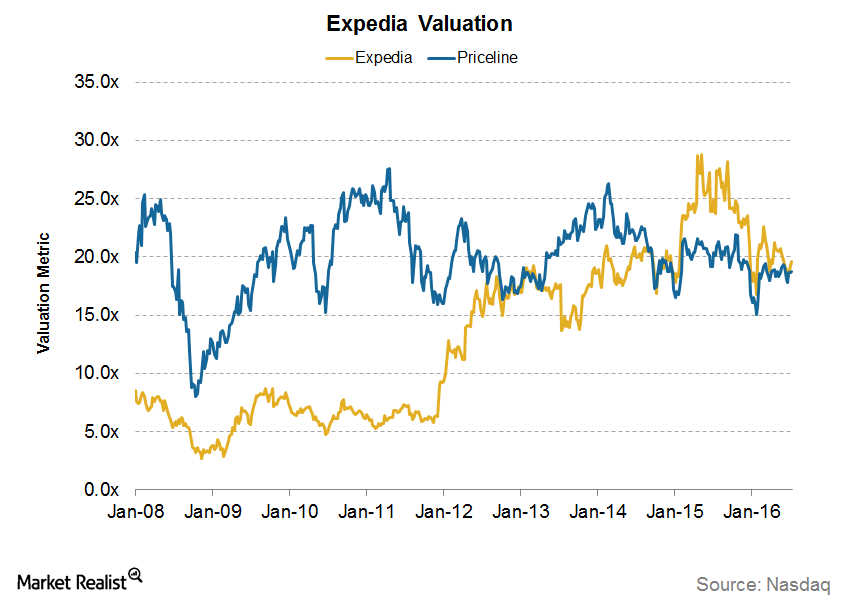
A Look at Expedia’s Valuation: How Does It Compare?
Expedia (EXPE) currently trades at a forward PE (price-to-earnings) multiple of 20x.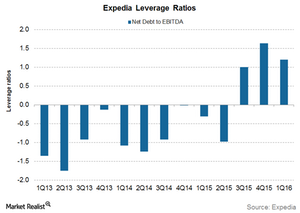
Investors Should Pay Attention to Expedia’s Increasing Leverage
Expedia and Priceline have shown interest in China’s Ctrip.com (CTRP), with Priceline also increasing its stake.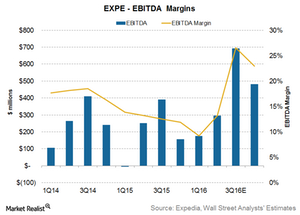
In Line with These Competitors, Expedia’s Margins to Increase
For 2Q16, analysts are estimating Expedia’s (EXPE) EBITDA to grow by 17% to $296 million with an EBITDA margin of 13%.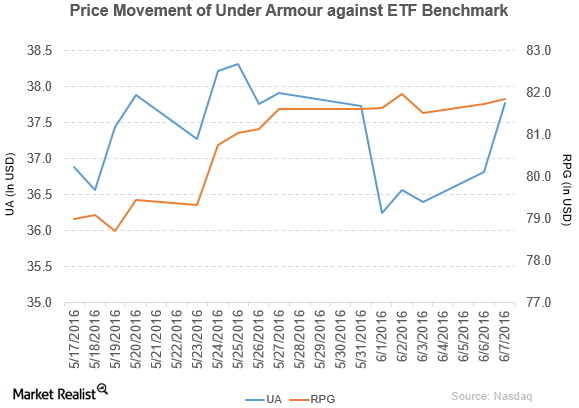
What Boosted Under Armour on June 7?
Under Armour rose by 2.6% to close at $37.77 per share on June 7. Its weekly, monthly, and YTD price movements were 0.11%, -2.4%, and -6.3%, respectively.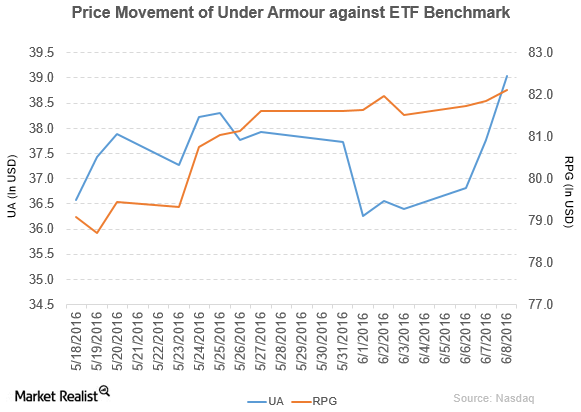
What Drove Under Armour’s Rise on June 8?
Under Armour (UA) has a market cap of $7.1 billion. It rose by 3.4% to close at $39.04 per share on June 8, 2016.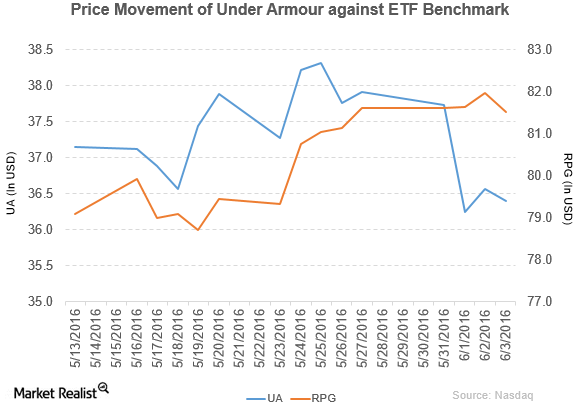
Under Armour Has Declared a Dividend for Its Class C Stock
Under Armour (UA) has a market cap of $6.7 billion. It fell by 0.44% to close at $36.40 per share on June 3, 2016.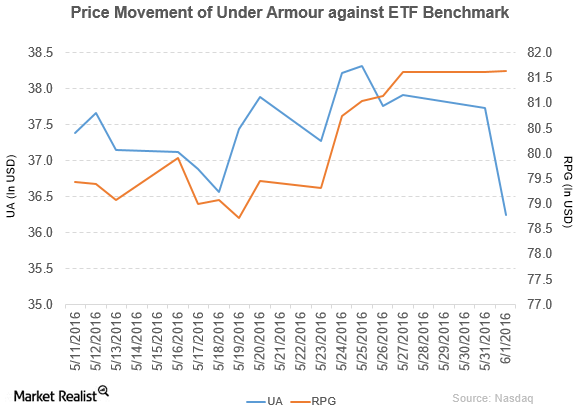
Under Armour Saw Its Price Target after Its Revised Outlook
Under Armour (UA) has a market cap of $6.6 billion. It fell by 3.9% to close at $36.25 per share on June 1, 2016.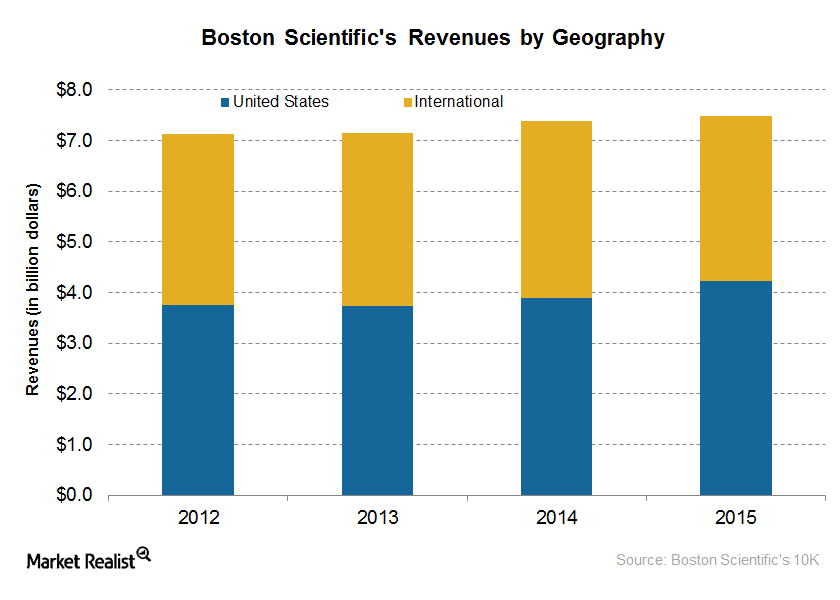
How Is Boston Scientific’s Geographic Strategy Driving Growth?
Boston Scientific has strategically expanded in these geographies through organic as well as inorganic strategies.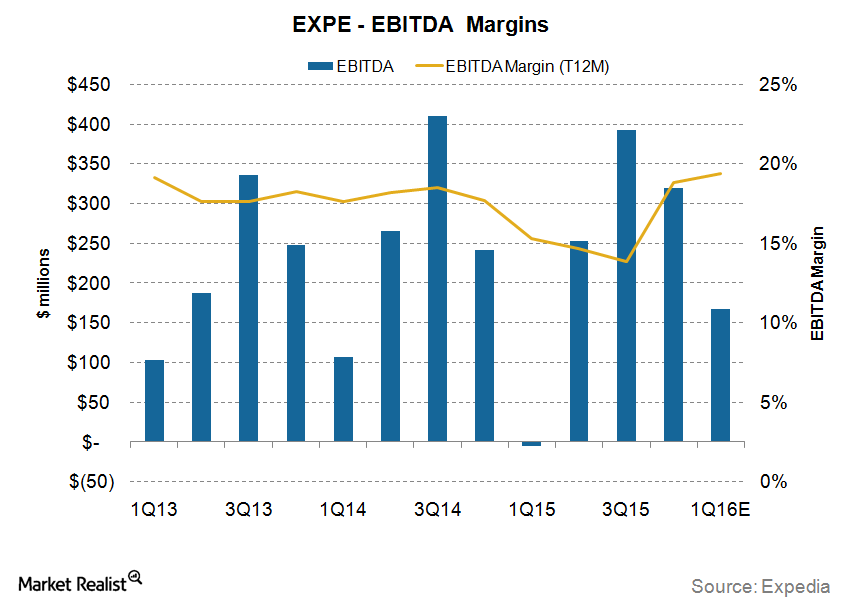
Why Are Expedia’s Margins Declining despite Growing Revenues?
Expedia’s EBITDA margins are expected to increase to 19% in 2016 and then rise to 21% in 2017. As a result, EBITDA growth is expected to increase to 42% and 27% in 2016 and 2017, respectively.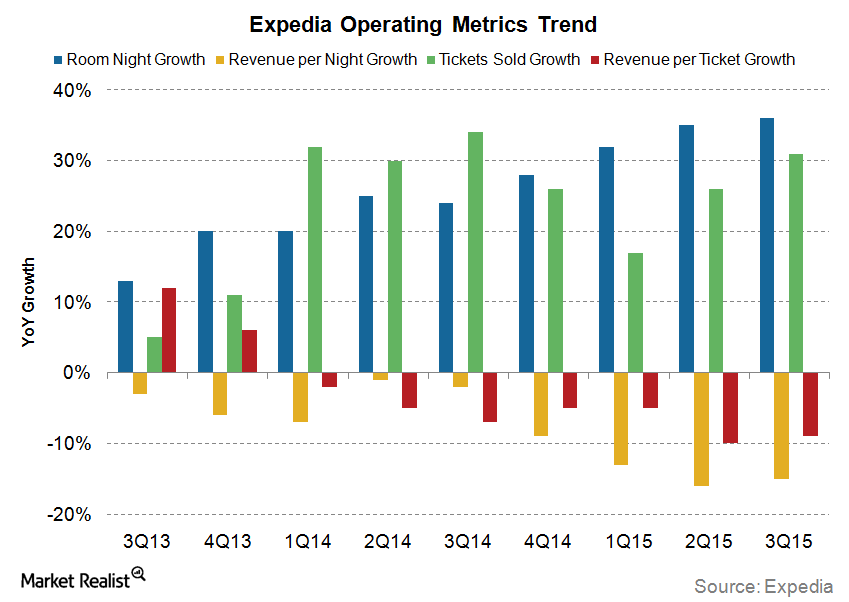
What Do Expedia’s Key Metrics Suggest?
For the last year, Expedia’s gross bookings increased 28% after increasing 16% for the two years before that. For the first nine months of 2015, gross bookings have increased 20%.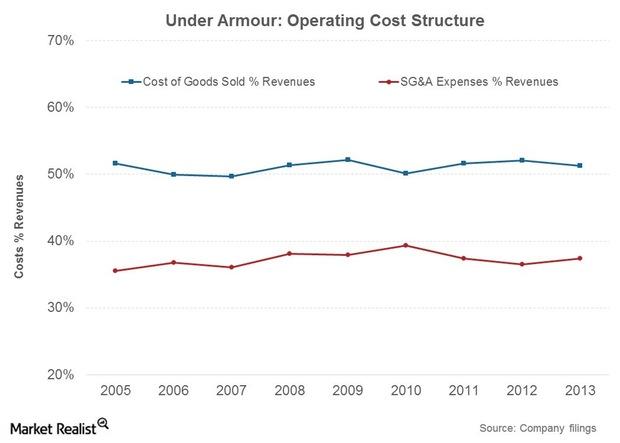
Under Armour’s Cost Profile And Outlook
Under Armour, Inc.’s cost of goods sold margins have been fairly steady over the years. SG&A costs are likely to trend higher in the near to medium term.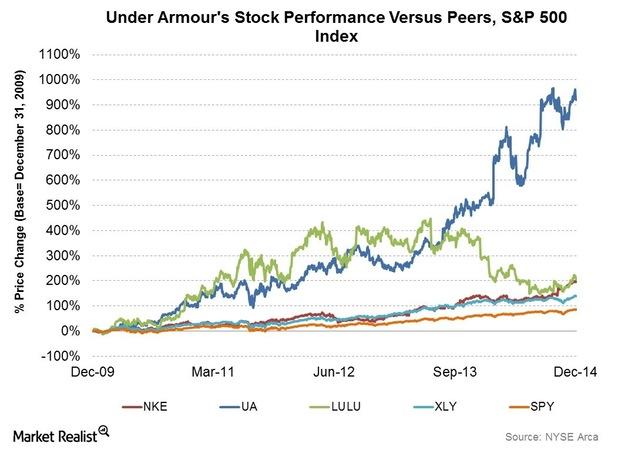
Understanding The Under Armour Growth Story
Under Armour’s stock price growth has been phenomenal—up by over 10x in the last five years. This dwarfs the ~200% increase seen by market leader NIKE.