What to Expect from US Gasoline Demand
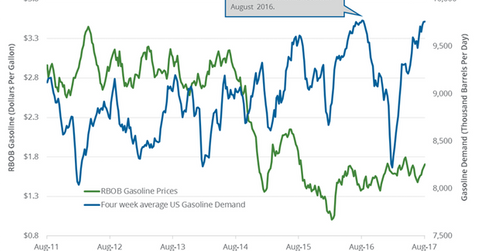
The EIA (U.S. Energy Information Administration) estimates that weekly US gasoline demand fell by 45,000 bpd (barrels per day), or 0.45%, to 9,797,000 bpd between July 28 and August 4, 2017.
Aug. 16 2017, Updated 11:36 a.m. ET

US gasoline demand
The EIA (U.S. Energy Information Administration) estimates that weekly US gasoline demand fell by 45,000 bpd (barrels per day), or 0.45%, to 9,797,000 bpd between July 28 and August 4, 2017. Gasoline demand rose by 28,000 bpd, or 0.3%, during the corresponding period in 2016. US gasoline demand rose due to a record distance traveled by US drivers.
The four-week average US gasoline demand rose by 3,000 bpd (barrels per day), or 0.1%, to 9,763,000 bpd between July 28 and August 4, 2017. High gasoline demand could have a positive impact on gasoline and crude oil (RYE) (VDE) prices. Higher crude oil and gasoline have a positive impact on the revenues of refiners and producers like Bill Barrett (BBG), Tesoro (TSO), Valero (VLO), and Bonanza Creek Energy (BCEI).
US gasoline demand’s peaks and lows
US gasoline demand hit a record 9.8 MMbpd (million barrels per day) in July 2017. In contrast, US gasoline demand was at 8.0 MMbpd in January 2017, the lowest level since February 2014.
US gasoline consumption estimates
The EIA estimates that US gasoline consumption will average 9.33 MMbpd in 2017. It also estimates that US gasoline consumption will average 9.36 MMbpd in 2018, which would be a record. Consumption averaged 9.33 MMbpd in 2016, a record high.
Impact
US gasoline demand rises at this time of the year due to the summer driving period. Demand may fall after the summer. High gasoline demand could support gasoline prices, which could have a positive impact on crude oil (BNO) (IEZ) prices.
In the next part, we’ll discuss China’s crude oil production and demand.
