The Fourth-Best-Performing Upstream Stock Year-to-Date
In 9M17, KOS’s production increased ~107.0% to ~7.8 million barrels when compared with 9M16.
Dec. 5 2017, Published 5:49 p.m. ET

Kosmos Energy’s year-to-date performance in 2017
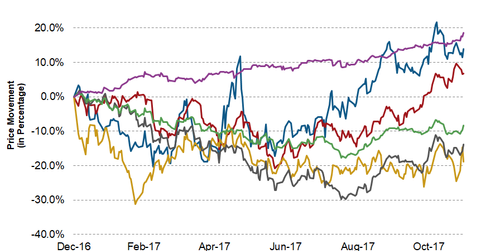
On December 1, 2017, Kosmos Energy (KOS) was the year’s fourth-best-performing stock from the oil and gas production—or upstream—sector in the US. Year-to-date, KOS has risen from its 2016 close of $7.01 to $7.99 on December 1 for an increase of ~14.0%.
Year-to-date, KOS has outperformed crude oil (USO) (USL) and natural gas (UNG). So far in 2017, crude oil has risen ~9.0% whereas natural gas has fallen ~18.0%.
In comparison, the SPDR S&P 500 ETF (SPY) has risen ~18.0%, and the SPDR Dow Jones Industrial Average ETF (DIA) has risen ~23.0% in 2017.
Kosmos Energy’s revenues and earnings
In 9M17, Kosmos Energy (KOS) reported revenues of ~$450.0 million, ~159.0% higher when compared with its 9M16 revenues of ~$174.0 million. KOS’s revenue growth was driven by the year-over-year higher production coupled with better realizations for crude oil prices.
In 9M17, KOS’s production increased ~107.0% to ~7.8 million barrels when compared with 9M16. Its crude oil price realizations in 9M17 were $49.94 per barrel—about 23.0% higher than in 3Q16.
In 9M17, KOS reported operating cash flows of ~$94.0 million, which represents a strong increase from its negative operating cash flows of ~$66.0 million in 9M16. The strong increase in operating cash flows in 2017 helped KOS reduce its debt and acquire key production assets in Equatorial Guinea.
Next, we’ll compare year-to-date returns from Matador Resources (MTDR) with the broader market and energy commodities. We’ll also analyze its fundamental metrics.
