Kosmos Energy Ltd
Latest Kosmos Energy Ltd News and Updates
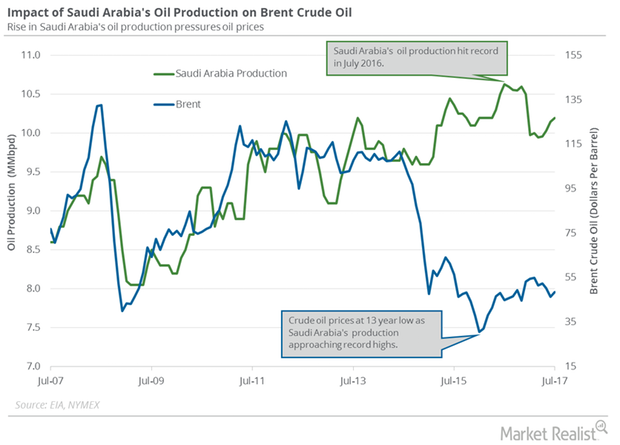
Will Saudi Arabia’s Production and Exports Support Crude Oil Futures?
The EIA (U.S. Energy Information Administration) estimates that Saudi Arabia’s crude oil production rose by 50,000 bpd (barrels per day) to 10.20 MMbpd (million barrels per day) in July 2017 compared to the previous month.Consumer Must-know: The Baupost Group’s 2Q14 positions
The size of the fund’s U.S. long portfolio increased 48% to $6.14 billion in the second quarter from $4.14 billion in the first quarter. The fund’s top positions include Micron Technology, Idenix Pharmaceuticals, and Viasat.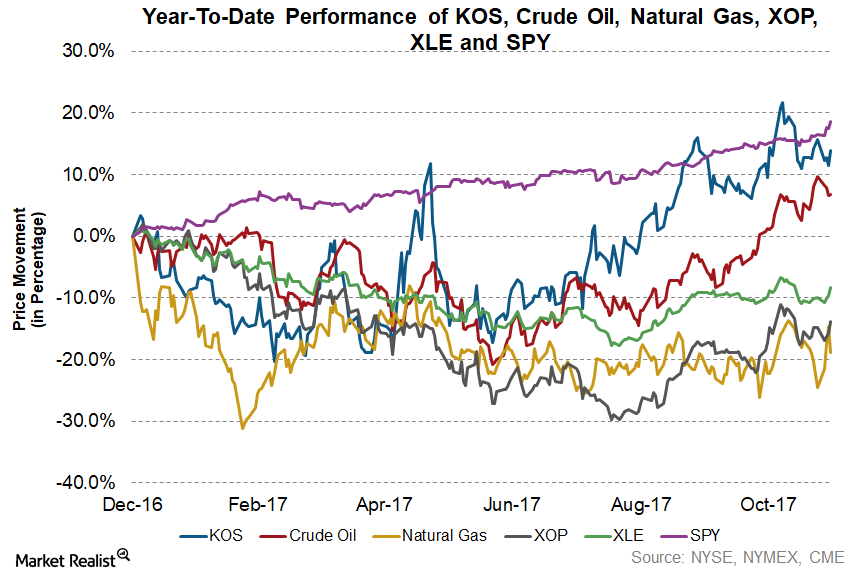
The Fourth-Best-Performing Upstream Stock Year-to-Date
In 9M17, KOS’s production increased ~107.0% to ~7.8 million barrels when compared with 9M16.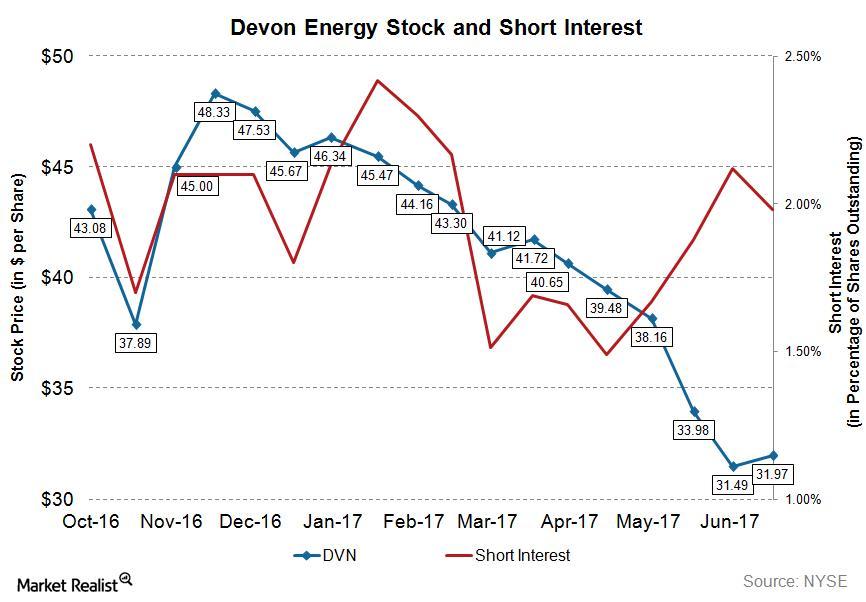
Analyzing Short Interest in Devon Energy Stock
As of June 30, 2017, Devon Energy’s (DVN) total shares shorted (or short interest) stood at ~10.4 million, whereas its average daily volume was ~5.9 million.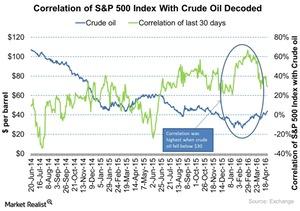
How Are Crude Oil Prices and the S&P 500 Correlated?
Historically, crude oil prices and the S&P 500 index have influenced each other.