Crude Oil Prices Skyrocket as OPEC Agrees to Cut Production
Crude oil prices hit a one-month high as OPEC reached an agreement to cut production by 1.2 MMbpd in its meeting in Vienna.
Nov. 20 2020, Updated 2:05 p.m. ET

Crude oil prices 
January 2017 WTI (West Texas Intermediate) crude oil futures contracts rose 9.3% and settled at $49.44 per barrel on November 30, 2016. Brent crude oil futures also rose 8.8% and closed at $50.47 per barrel.
Crude oil prices hit a one-month high as OPEC (Organization of the Petroleum Exporting Countries) reached an agreement to cut production by 1.2 MMbpd (million barrels per day) in its meeting in Vienna. The unexpected fall in US crude oil inventories supported crude oil prices.
ETFs like the United States Oil ETF (USO) and the ProShares Ultra Bloomberg Crude Oil ETF (UCO) follow crude oil futures contracts. These ETFs rose 8.7% and 16.7%, respectively, on November 30, 2016.
OPEC’s meeting 
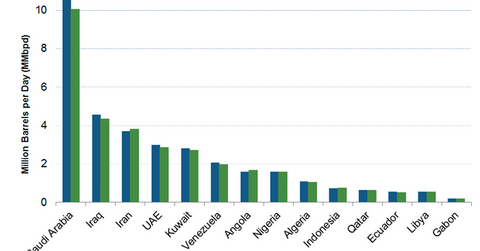
In its meeting, OPEC also stated that non-OPEC producers along with Russia should reduce production by 600,000 bpd (barrels per day). OPEC members could start reducing crude oil production from January 2017. OPEC members including Saudi Arabia, Kuwait, the United Arab Emirates, and Qatar are expected to contribute to major production cuts, as you can see in the above chart. Nigeria, Indonesia, and Libya might have been exempt from production cuts. Iran has been allowed to increase crude oil production by 90,000 bpd. However, Iraq is expected to reduce its production by 200,000 bpd.
Saudi Arabia’s energy minister said that it would have the highest production cut of 486,000 bpd. Russia’s energy minister suggested that it might cut production by 300,000 bpd.
US crude oil inventories 
The EIA (U.S. Energy Information Administration) released its weekly crude oil inventory report on November 30, 2016. It reported that US crude oil inventories fell by 0.9 MMbbls (million barrels) from November 18–25, 2016.
We’ll look at US crude oil inventories and their regional breakdown in Part 3 of this series. For details on gasoline and distillate inventories, read Part 7 and Part 8 of this series. Earlier, the American Petroleum Institute estimated that US crude oil inventories fell by 0.7 MMbbls from November 18–25, 2016.
Crude oil volatility index  
The CBOE crude oil volatility index fell 19.7% to 44.3 on November 30, 2016. It hit 32.7 on October 19, 2016—its lowest level since June 26, 2015. In contrast, it hit 50.1 on November 30, 2016—the highest level in the last nine months.
Volatility in crude oil prices can impact oil and gas producers’ earnings like ExxonMobil (XOM), Chevron (CVX), Warren Resources (WRES), and Goodrich Petroleum (GDP).
Moves in crude oil and natural gas prices also impact funds such as the iShares Global Energy ETF (IXC), the Fidelity MSCI Energy ETF (FENY), the SPDR S&P Oil & Gas Exploration & Production ETF (XOP), the SPDR S&P Oil & Gas Exploration & Production ETF (XOP), the iShares U.S. Energy ETF (IYE), the Guggenheim S&P 500 Equal Weight Energy ETF (RYE), and the United States Brent Oil ETF (BNO).
Series focus 
In this series, we’ll look at US crude oil production, refinery demand, imports, and US gasoline and distillate inventories. We’ll start by looking at US crude oil prices in early morning trade on December 1.
