Sanofi’s Position Compared to Its Peers
The forward PE ratio for Sanofi is ~15.1x for 2015, and ~18.1x for the industry.
July 29 2015, Updated 9:05 a.m. ET

Sanofi and peers
As discussed earlier, Sanofi (SNY) is engaged in the pharmaceuticals, human vaccines, and animal health segments. Its close competitors include AbbVie (ABBV), Merck and Co. (MRK), Novartis (NVS), Eli Lilly (LLY), Pfizer (PFE), and AstraZeneca (AZN).
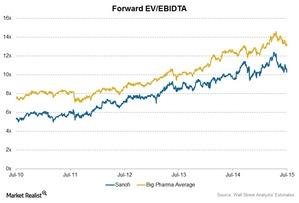
Pharmaceutical and healthcare companies are capital intensive companies, and they have high levels of debt on their balance sheets due to heavy setup costs. The EV/EBITDA (or enterprise value to earnings before interest, tax, depreciation, and amortization) is often used to value capital intensive, cyclical, and volatile industries. The metric is also capital-structure-neutral, and reflects the value of the business to both debt and equity holders. The above chart compares the forward enterprise multiple (or forward EV/EBIDTA multiple) trend for five years for Sanofi and the industry.
EV-to-EBIDTA multiple
The forward EV-to-EBIDTA multiple for Sanofi is ~10.6x, which is lower than the industry average of ~13.3x. This is due to fewer patented products and expected revenue loss for its key product, Lantus, in the near future. The enterprise multiples for Merck and Co. (MRK), AstraZeneca (AZN), Pfizer (PFE), and AbbVie (ABBV) are ~11.7x, ~12.5x, ~10.5x, and ~11.8x, respectively.
PE multiple
The price-to-earnings (or PE) multiple is one of the simplest multiples used for valuations. It is one of the most widely used valuation multiples measuring what price the shareholders are willing to pay per unit dollar of a company’s earnings. The forward PE ratio for Sanofi is ~15.1x for 2015, while its ~18.1x for the industry.
ETFs like the Health Care Select Sector SPDR ETF (XLV) and the iShares US Healthcare ETF (IYH) are focused on pharmaceutical companies.
