Why ConocoPhillips Stock Is Outperforming Crude Oil and Peers
In the last two weeks, the stock of ConocoPhillips (COP), a crude oil (USO) and natural gas (UNG) producer, has outperformed crude oil prices.
March 13 2017, Published 3:24 p.m. ET

Outperformance
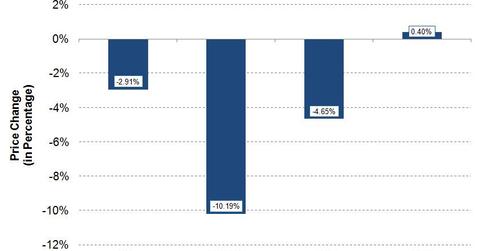
In the last two weeks, the stock of ConocoPhillips (COP), a crude oil (USO) and natural gas (UNG) producer, has outperformed crude oil prices. It has fallen from $47.04 to $45.67. Crude oil prices fell steeply, from $53.99 per barrel to $48.49 per barrel during the same period.
In 2016, COP stock rose ~10.0%. So far in 2017, it has fallen ~9.0%. COP stock hit its 52-week low of $38.19 on April 5, 2016. It hit its 52-week high of $53.17 on December 13, 2016.
Did COP peers also outperform?
COP’s peers Devon Energy (DVN), Consol Energy (CNX), and Occidental Petroleum (OXY) have fallen ~6.0%, ~4.0%, and ~2.0%, respectively, in the last two weeks. Even though oil and gas exploration and production companies (XOP) outperformed crude oil, they lagged behind the S&P 500 (SPY) over the last two weeks.
How COP stock performed over the medium term
COP stock rallied from its low of $38.37 in August 2016 to a high of $52.89 in December, 2016. Since then, the stock has been in a moderate downtrend and could be consolidating its gains. Currently, COP is trading below its 50-day moving average but above its 200-day moving average.
On March 10, 2017, COP stock closed at $45.67. Its 50-day and 200-day moving averages were $49.03 and $44.75, respectively. COP’s 50-day moving average fell two weeks ago, but its 200-day moving average is still trending upward.
Next, let’s analyze the possible trading range for COP stock this week based on its implied volatility.
