T. Rowe Price Group Inc
Latest T. Rowe Price Group Inc News and Updates
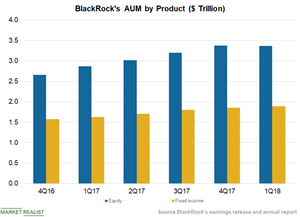
BlackRock’s Diversified Offerings Can Benefit from Rate Hikes
In the first quarter, BlackRock managed ~$1.9 trillion in fixed income offerings, up from ~$1.6 trillion in the first quarter of 2017.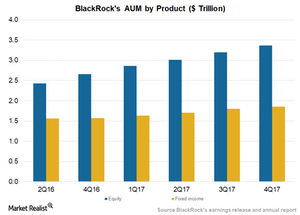
Interest Rate Expectations Have Jolted Equity and Debt Alike
Asset managers (VFH) are seeking stability in order to attract funds toward either equity or debt offerings.
How to Pick Asset Management Stocks to Invest in
If you’re looking to diversify your portfolio, asset management stocks are worth a look. Here’s how to pick the right asset management stock to invest in.
The salient features of mutual funds
There are investors who are willing to take on higher risk to generate above-average market returns. For these investors, active funds offer the optimal investment avenue.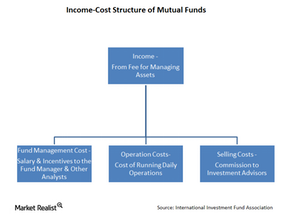
Show it: How mutual funds make money
In return for investing a client’s money, mutual funds charge a fee, generally an annual fee set as a percentage of the client’s assets. This fee is the only source of income for a mutual fund-focused asset manager.
A Look at T. Rowe Price’s Assets under Management
Asset classes In its investor presentation on February 21, 2018, T. Rowe Price (TROW) stated that its core business is helped by the allocation of its AUM (assets under management) in different asset classes and its strong client base. However, the company also believes that targeting new opportunities is crucial for its core business. Of its total AUM, […]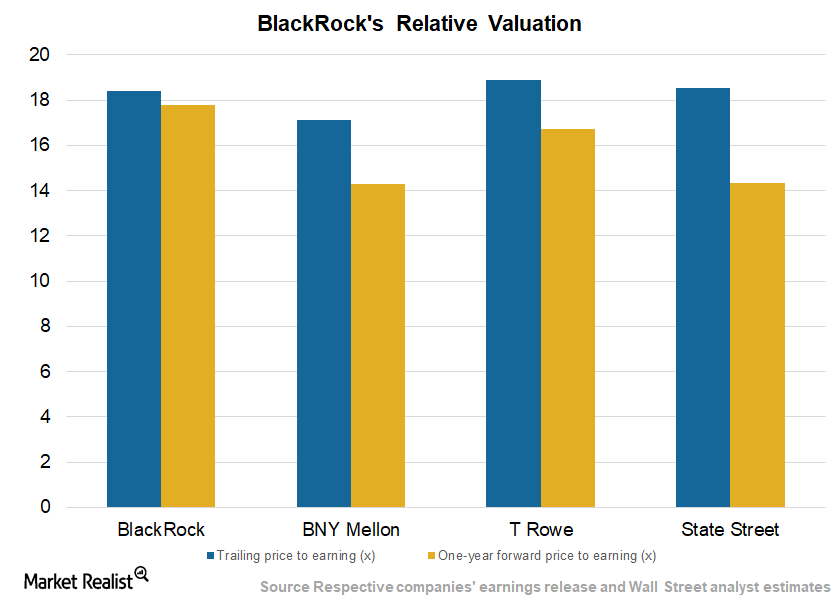
BlackRock’s Valuations Stable amid Strong Operating Performance
BlackRock is currently trading at a forward price-to-earnings ratio of 17.6x, compared with the industry average of 18.6x.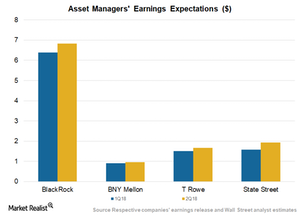
BlackRock and Competitors Look at Strong 1Q18 Numbers
Among the major asset managers, BlackRock (BLK) is expected to post sequential and year-over-year growth in earnings per share to $6.38 in 1Q18 and $6.83 in 2Q18.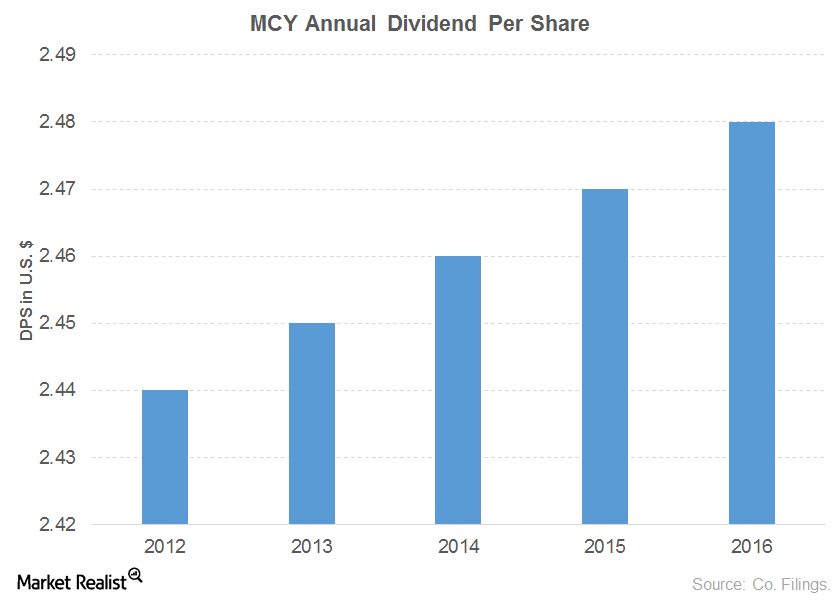
The Top Dividend-Growing Financial Sector Stocks
Mercury General (MCY) has consistently recorded revenue growth since fiscal 2011, except for a minor decline in fiscal 2015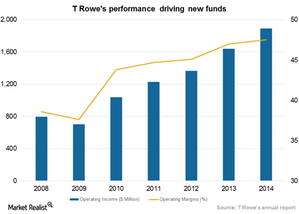
T. Rowe Price Group: It Takes Seed Capital to Build New Funds
The length of time seed capital is held in a portfolio depends on various factors such as how long it takes to generate cash flow from unrelated investors.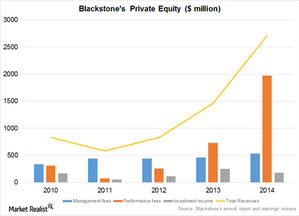
Blackstone relies on private equity division to drive growth
Blackstone (BX) manages a total of $73 billion assets in the private equity segment and has generated an annual return of 16% since its inception.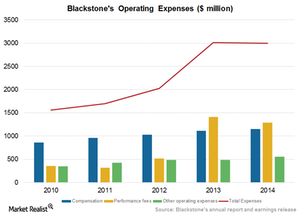
Compensation packages at Blackstone among the best in the biz
Blackstone’s performance fees have increased more than its basic compensation costs because the companies in which it invests have performed so well.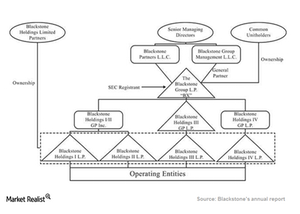
Understanding the Blackstone partnership structure
A partnership structure has general partners that make investments and operational decisions relating to the conduct of the fund’s business.