J&J Snack Foods Corp
Most Recent
ConsumerHow Has Flowers Foods Stock Performed in 2018?
As of July 30, Flowers Foods (FLO) stock had risen 5.6% to $20.39 on a YTD (year-to-date) basis.
ConsumerEvaluating Flowers Foods’ Dividend Yield and Valuation
Flowers Foods’ (FLO) quarterly dividend payout stands at $0.18 per share. The company last hiked its dividend by 5.9% in June.
ConsumerHow Has Flowers Foods Stock Fared in 2018?
As of May 4, 2018, Flowers Foods (FLO) stock price was trading at $22.34, a rise of 15.7% YTD (year-to-date).
ConsumerAnalyzing Flowers Foods’ Valuation and Dividend Yield
As of February 9, 2018, Flowers Foods (FLO) was trading at a 12-month forward PE (price to earnings) multiple of 19.5x.
ConsumerFlowers Foods Stock Spikes after 4Q17 Results
Flowers Foods’ (FLO) adjusted EPS (earnings per share) of $0.17 and sales of $873.6 million in fiscal 4Q17 easily topped the analysts’ estimate of $0.15 and $861 million, respectively.
Earnings ReportHow Did J&J Snack Foods Perform in Fiscal 1Q17?
J&J Snack Foods (JJSF) reported fiscal 1Q17 net sales of $225.6 million, a rise of 1.2% compared to net sales of $222.9 million in fiscal 1Q16.
Company & Industry OverviewsDelphi Automotive Announces New Addition to Its Management Team
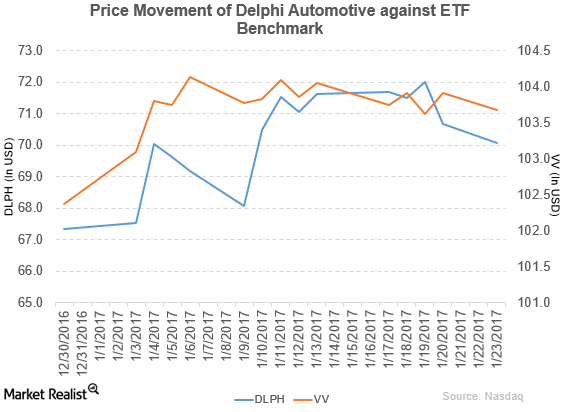
Price movement Delphi Automotive (DLPH) has a market cap of $19.3 billion. It fell 0.83% to close at $70.07 per share on January 23, 2017. The stock’s weekly, monthly, and year-to-date (or YTD) price movements were -2.2%, 4.2%, and 4.0%, respectively, on the same day. DLPH is trading 0.87% above its 20-day moving average, 2.8% […]
Company & Industry OverviewsWhy J&J Snack Foods Got Downgraded to ‘Neutral’
J&J Snack Foods (JJSF) has a market cap of $2.5 billion. It rose 1.4% to close at $134.61 per share on January 4, 2017.
Company & Industry OverviewsAltria Group Gets Upgraded to a ‘Buy’
Altria Group (MO) has a market cap of $132.8 billion. It rose 0.33% to close at $67.85 per share on January 4, 2017.
Company & Industry OverviewsEcolab Declares a Dividend of $0.37 per Share
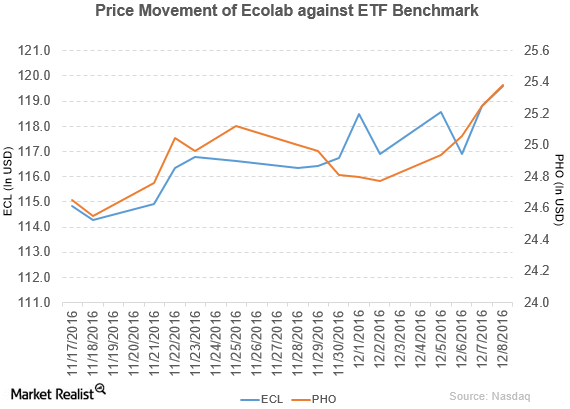
Price movement Ecolab (ECL) has a market cap of $35.4 billion. It rose 0.67% to close at $119.61 per share on December 8, 2016. The stock’s weekly, monthly, and year-to-date (or YTD) price movements were 0.95%, 5.3%, and 5.5%, respectively, on the same day. ECL is trading 3.0% above its 20-day moving average, 2.7% above […]
Company & Industry OverviewsJ&J Snack Foods Declares a Dividend of $0.42 per Share
Price movement J&J Snack Foods (JJSF) has a market cap of $2.4 billion. It rose 1.7% to close at $129.40 per share on December 8, 2016. The stock’s weekly, monthly, and year-to-date (or YTD) price movements were 7.9%, 11.6%, and 12.1%, respectively, on the same day. JJSF is trading 6.1% above its 20-day moving average, […]
Company & Industry OverviewsSnyder’s-Lance Plans to Sell Diamond of California
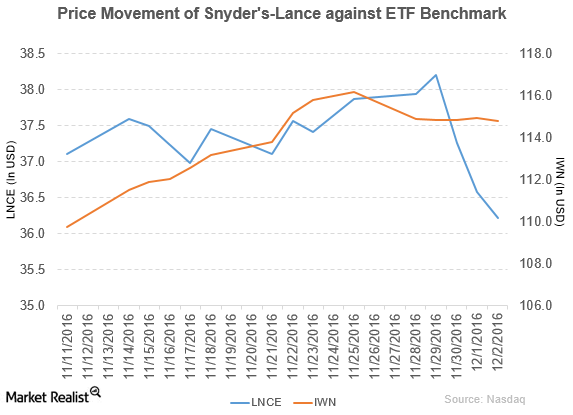
Snyder’s-Lance (LNCE) fell 4.4% to close at $36.22 per share during the fifth week of November 2016.
Company & Industry OverviewsSnyder’s-Lance Declares Dividend of $0.16 per Share
Snyder’s-Lance (LNCE) has a market cap of $3.4 billion. It fell 0.12% to close at $34.64 per share on November 4, 2016.
Earnings ReportHow Did Snyder’s-Lance Perform in 3Q16?
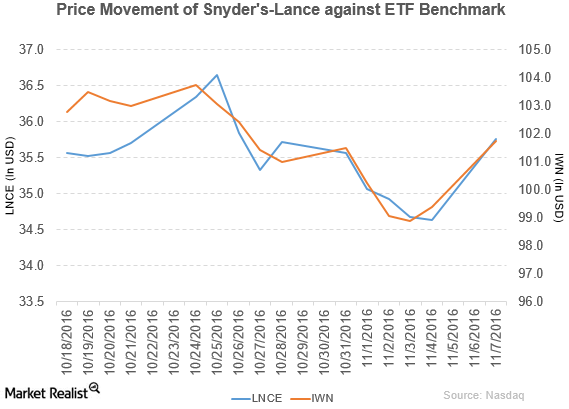
Price movement Snyder’s-Lance (LNCE) has a market cap of $3.5 billion. It rose 3.2% to close at $35.76 per share on November 7, 2016. The stock’s weekly, monthly, and year-to-date (or YTD) price movements were 0.53%, 4.4%, and 5.8%, respectively, on the same day. LNCE is trading 1.2% above its 20-day moving average, 3.1% above […]
Company & Industry OverviewsSnyder’s-Lance Appoints Pease as Executive Vice President
Price movement Snyder’s-Lance (LNCE) has a market cap of $3.3 billion. It fell 1.8% to close at $34.10 per share on September 23, 2016. The stock’s weekly, monthly, and year-to-date (or YTD) price movements were 1.3%, -3.3%, and 0.92%, respectively, on the same day. LNCE is trading 1.5% below its 20-day moving average, 1.8% below […]
Company & Industry OverviewsSnyder’s-Lance Acquired Metcalfe’s Skinny to Expand Its Business
Snyder’s-Lance fell by 1.1% to close at $34.95 per share on September 1, 2016. Its weekly, monthly, and YTD price movements were -2.4%, 2.2%, and 3.4%.
Company & Industry OverviewsWhy Did Snyder’s-Lance Recall Some of Its Products?
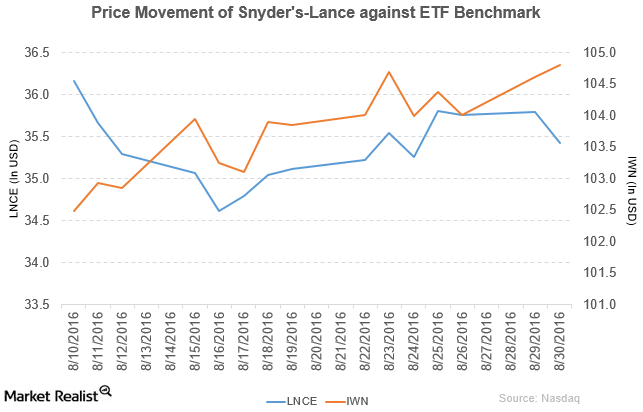
Snyder’s-Lance (LNCE) has a market cap of $3.4 billion. It fell by 1.0% to close at $35.42 per share on August 30, 2016.
Company & Industry OverviewsKeyBanc Rated J&J Snack Foods as ‘Sector Weight’
J&J Snack Foods (JJSF) has a market cap of $2.3 billion. It rose by 0.33% and closed at $122.79 per share on August 22, 2016.
Company & Industry OverviewsGeneral Motors: Why It Rose on August 22
General Motors (GM) has a market cap of $49.3 billion. It rose by 0.13% and closed at $31.87 per share on August 22, 2016.
ConsumerAnalyzing Snyder’s-Lance Performance in 2Q16
Snyder’s-Lance rose by 2.8% and closed at $35.29 per share during the second week of August 2016. It reported fiscal 2Q16 net revenue of $609.5 million.
Company & Industry OverviewsJ&J Snack Foods Declares Dividend of $0.39 Per Share
J&J Snack Foods (JJSF) has a market cap of $2.3 billion. It rose by 0.17% to close at $121.48 per share on August 11, 2016.
ConsumerHow Did J&J Snack Foods Perform in 3Q16?
J&J Snack Foods (JJSF) rose by 0.35% to close at $121.61 per share during the fourth week of July 2016.
ConsumerKey Moving Averages: Analyzing Kellogg versus Its Peers
Kellogg closed at $82.84 on July 26. It’s trading 7.0%, 5.4%, and 0.4% above its 100-day, 50-day, and 20-day moving averages. It has appreciated ~15% in 2016.
ConsumerHow’s ADM Advancing with Its Portfolio Management Strategy?
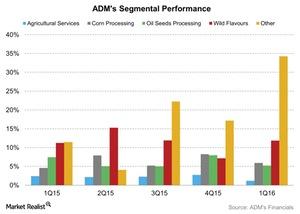
As part of its portfolio management strategy, Archer Daniels Midland (ADM) sold its Brazilian sugar cane ethanol operations.
ConsumerHow Can WhiteWave Foods Add to Danone’s Business?
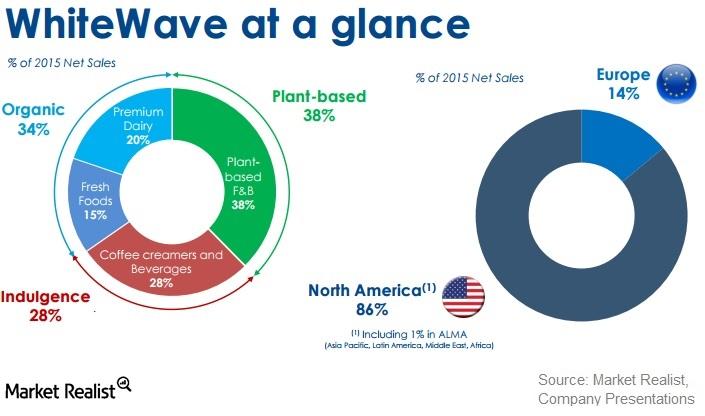
WhiteWave Foods (WWAV) currently generates around 80%–85% of its total revenue and operating profit from North America alone.
ConsumerWhy Did JPMorgan Chase Downgrade WhiteWave Foods?
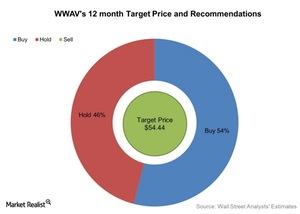
On July 8, 2016, JPMorgan Chase (JPM) downgraded WhiteWave Foods’ (WWAV) stock to a “neutral” rating from an “overweight” rating.
ConsumerWhat Synergies Is J.M. Smucker Targeting for the Future?
The J.M. Smucker Company expects to realize $100 million in incremental synergies in fiscal 2017, which would make its total ~$135 million for 2017.
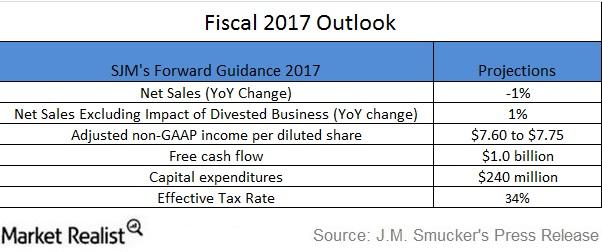
ConsumerWhat Are J.M. Smucker’s Expectations for Fiscal 2017?
During its fiscal 4Q16 earnings release and in its investor presentation last week, the J.M. Smucker Company (SJM) discussed its outlook for fiscal 2017.
ConsumerWhat Drove Down General Mills’ Revenue Growth for Fiscal 4Q16?
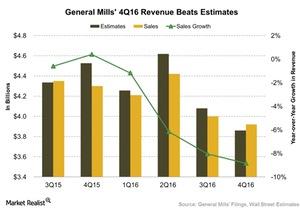
General Mills’ (GIS) net sales for fiscal 4Q16 fell 9% year-over-year. However, they beat analysts’ estimates by 2%.
ConsumerWhy Did General Mills’ Earnings Fall in Fiscal 4Q16?
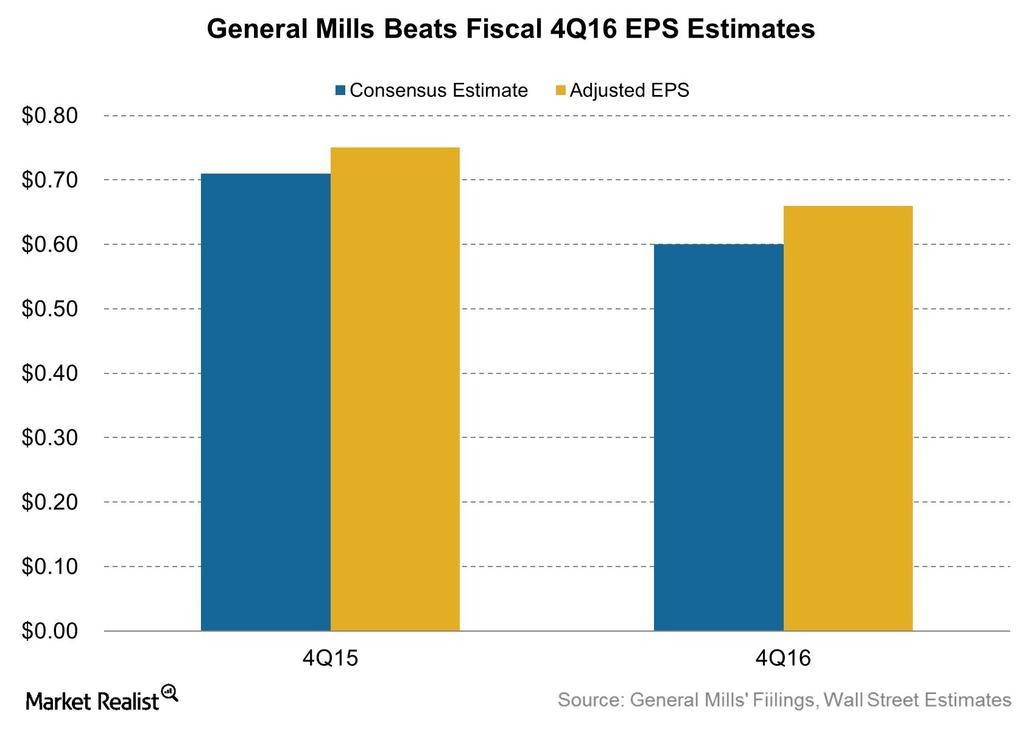
General Mills’ (GIS) fiscal 4Q16 earnings beat estimates by 10%. Adjusted EPS, however, declined 12% compared to fiscal 4Q15.
Earnings ReportWhat Was McCormick’s Revised Proposal to Acquire Premier Foods?
On March 30, a day after the company’s fiscal 1Q16 earnings release, McCormick announced a revised proposal to the board of Premier Foods of 65 pence in cash per Premier Foods share.
Company & Industry OverviewsHow Did Snyder’s-Lance Perform in 2015?
Snyder’s-Lance (LNCE) has a market cap of $2.2 billion. LNCE fell by 0.38% to close at $31.38 per share on March 3, 2016.
Company & Industry OverviewsHow Did Snyder’s-Lance Perform in 4Q15 and 2015?
Snyder’s-Lance (LNCE) has a market cap of $2.3 billion. LNCE rose by 1.1% to close at $32.71 per share on February 29, 2016.
Earnings ReportWhat Are Analysts Recommending for B&G Foods?
Stephens and RBC Capital Markets have given B&G Foods the highest target prices of $45 and $43, respectively, which represent a potential to rise by 24% and 18%, respectively.
Earnings ReportWhat Are Analysts’ Recommendations for Pinnacle Foods?
Pinnacle Foods released its earnings for 4Q15 and full-year 2015. The results show that 53% of analysts rate Pinnacle Foods a “buy” and ~47% rate it a “hold.”
Earnings ReportPinnacle Foods Is Trading above Its Key Moving Averages
Pinnacle Foods (PF) is trading 1.9% above its 100-day moving average, 2.9% above its 50-day moving average, and 3.7% above its 20-day moving average.