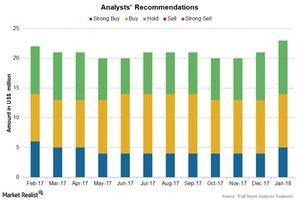
Wall Street Recommendations for Mylan in January 2018
As we discussed earlier in this series, Mylan (MYL) reported revenues of $2.98 billion in 3Q17, a 2.3% decline in revenues compared to $3.06 billion in 3Q16.
Jan. 12 2018, Updated 7:31 a.m. ET

Wall Street analysts’ estimates
As we discussed earlier in this series, Mylan (MYL) reported revenues of $2.98 billion in 3Q17, a 2.3% decline in revenues compared to $3.06 billion in 3Q16. Wall Street analysts estimate that Mylan will generate earnings per share (or EPS) of $1.41 on revenues of $3.32 billion in 4Q17—1.6% growth in revenues from $3.27 billion in 4Q16. For 2017 overall, Wall Street analysts estimate that Mylan will generate EPS of $4.54 on revenues of $11.99 billion—8.2% growth from revenues of $11.08 billion in 2016.
The above chart shows analysts’ recommendations for Mylan’s stock over the last 12 months.
Analyst recommendations
Mylan’s stock has increased ~15.7% over the last 12 months. Wall Street analysts estimate that the stock has the potential to return 4.1% over the next 12 months. Analysts’ recommendations show a 12-month targeted price of $46.38 per share compared to $44.56 per share as of January 8, 2018.
On January 10, there are 23 analysts tracking Mylan’s stock. Of these 23 analysts, 14 analysts recommend a “buy” while nine analysts recommend a “hold.” None of the analysts recommend a “sell.” The consensus rating for Mylan stands at 2.17, which represents a “buy” for long-term investors and value investors. Changes in analysts’ recommendations and estimates for target prices are based on changes in stock price trends as well as company performance.
Notably, the First Trust NASDAQ Pharmaceuticals ETF (FTXH) invests 4.6% of its total investments in Mylan (MYL), 7.7% in Johnson & Johnson (JNJ), 3.9% in Eli Lilly and Co. (LLY), and 3.9% in Merck & Co. (MRK).
