Natural Gas Market Could Be Pricing In a Supply Deficit
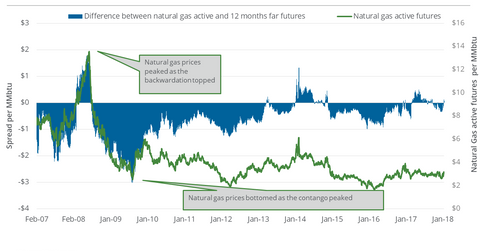
On January 16, 2018, the gap between natural gas’s February 2018 futures and February 2019 futures was $0.07, or the futures spread.
Jan. 17 2018, Published 2:29 p.m. ET

Futures spread
On January 16, 2018, the gap between natural gas’s February 2018 futures and February 2019 futures was $0.07, or the futures spread. It was at a premium of $0.07. That same day, natural gas’s February 2018 futures settled above February 2019 futures. However, on January 9, 2018, the futures spread was at a discount of $0.13. Between those two dates, natural gas futures rose 7%.
When the futures spread shifts to a premium from a discount as it did in the trailing week, it could be a bullish sign for natural gas prices. A further expansion in the premium could increase natural gas’s gains.
Inversely, a switch in the spread to a discount could be negative for prices. When the futures spread is at a discount and the discount rises, natural gas prices could fall. For example, on March 3, 2016, the discount was at $0.84 with natural gas closing at its lowest level in the last 17 years. But a fall in the discount could be bullish for natural gas prices.
In the seven calendar days to January 16, 2018, the futures spread shifted from a discount to a premium. Natural gas prices rose 7% in that period, which could indicate a market expectation for a possible supply deficit in natural gas.
Energy sector
The hedging operations of US natural gas producers (XOP) (DRIP) (IEO) rely on the natural gas futures forward curve. The midstream sector’s (AMLP) natural gas transportation, storage, and processing related activities also depend on it.
On January 16, 2018, natural gas (FCG) futures contracts for delivery until May 2018 were priced in a descending pattern. The ProShares Ultra Bloomberg Natural Gas (BOIL) and the United States Natural Gas ETF (UNG) could benefit from this price pattern because they hold natural gas futures.
