Why EQT’s Normalized Free Cash Flow Is Improving
As we saw in part one of this series, EQT (EQT) had normalized free cash flows of ~5% in the first nine months of 2017, the fifth highest among crude oil (USO) and natural gas (UNG) (UGAZ) producers we have been tracking.
Dec. 22 2017, Updated 9:03 a.m. ET

EQT’s normalized free cash flow in 2017
As we saw in part one of this series, EQT (EQT) had normalized free cash flows of ~5% in the first nine months of 2017, the fifth highest among crude oil (USO) and natural gas (UNG) (UGAZ) producers we have been tracking. In this part, we’ll look at how EQT’s free cash flow and normalized free cash flow are trending.
EQT’s free cash flow trend
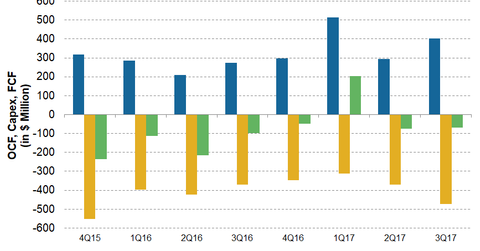
In 3Q17, EQT (EQT) reported FCF (free cash flow) of -$70 million, which is higher when compared with its FCF of -$97 million in 3Q16. In the last four quarters, EQT’s (EQT) FCF showed an inverted U-shaped trend.
EQT’s normalized free cash flow trend
In the last one year, EQT’s (EQT) normalized free cash flow rose from ~-35% in 3Q16 to ~-17% in 3Q17. The increase in EQT’s normalized FCF in the last four quarters can be attributed to the higher increase of ~47% of its operating cash flow to ~$402 million compared to the increase of ~27% in its capital expenditures to ~$472 million.
EQT’s stock performance in 2017
Year-to-date in 2017, EQT’s stock is down by ~16.9%. In comparison, the First Trust Natural Gas ETF (FCG), which contains upstream companies that are primarily natural gas producers, decreased by ~15.4%, whereas the SPDR S&P500 ETF (SPY) rose ~21.8%.
Next, we will take a look at the worst normalized free cash flow upstream companies in the US. Let’s start with Extraction Oil and Gas’s (XOG) free cash flow trends.
