Bullish Oil Traders Must Count the Oil Rigs
On November 24, 2017, US crude oil settled at the highest closing price in 2017. The oil rig count could be at a three-year high by May 2018.
Nov. 20 2020, Updated 2:01 p.m. ET

Oil rig count
In the week ending December 8, 2017, the US oil rig count rose by two. For the same week, the oil rig count was at 751. In the last three weeks, the oil rig count rose continuously. After the week ending November 17, 2017, US crude oil prices rose 2.5%. Rising US production, fueled by the rise in the number of active rigs, could limit the upside in oil prices.
A pattern
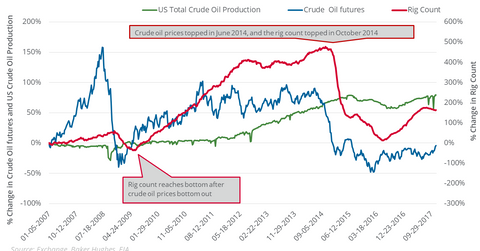
Usually, oil prices’ tops and bottoms lead the oil rig count’s tops and bottoms by three to six months. For example, US crude oil fell to a 12-year low in February 2016. In May 2016, just three months after oil’s fall, the oil rig count was at a 6.5-year low of 316.
From its multiyear low, US crude oil prices rose 121.3%. Similarly, the oil rig count has more than doubled from its 6.5-year low. US crude oil production has risen 11.1% since May 2016. So, the oil rig count could be a key indicator for US crude oil supplies.
On November 24, 2017, US crude oil settled at the highest closing price in 2017. Applying the pattern, the oil rig count could be at a three-year high by May 2018. US crude oil production is already at record levels, according to weekly EIA data.
So, the rise in the oil rig count could be a concern for US oil producers’ (XLE) (FENY) stock prices. Equity indexes like the S&P 500 Index (SPY) and the Dow Jones Industrial Average Index (DIA) could also be impacted by any fall in oil prices.
