What Really Moved W&T Offshore Stock Last Week?
W&T Offshore (WTI) stock rose ~7% last week (ended September 29), while crude oil and the SPDR S&P 500 ETF (SPY) rose ~2% and ~0.7%, respectively.
Oct. 4 2017, Updated 9:11 a.m. ET

W&T’s correlations last week
W&T Offshore (WTI) stock rose ~7% last week (ended September 29, 2017), while crude oil and the SPDR S&P 500 ETF (SPY) rose ~2% and ~0.7%, respectively, but natural gas prices closed one-half of a percentage point lower.
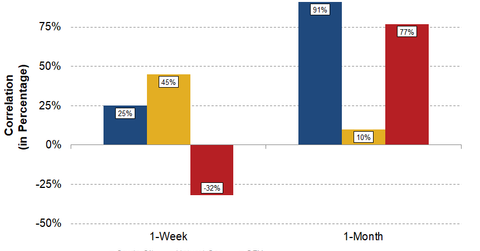
W&T Offshore stock showed a correlation of ~25% with crude oil (USO) (SCO) last week, which means that over the past five days, the daily movements in crude oil had a very small influence on the stock. Crude prices took a breather starting on Tuesday of last week, but WTI stock kept rising until Thursday.
But WTI stock’s correlation with natural gas (UNG) was stronger at ~45% last week. The stock’s correlation with SPDR S&P 500 ETF (SPY) came in at about -32%, meaning that the daily movements in the S&P 500 Index had no influence on WTI’s stock price last week.
WTI stock has shown correlations of ~91%, ~10% and ~77% with crude oil (USO), natural gas (UNG), and the SPDR S&P 500 ETF (SPY), respectively, over the past month.
Peers
Peer Murphy Oil (MUR) showed a correlation of ~73% with crude oil prices last week, rising ~2% due to the rise in crude prices. MUR showed a correlation of ~76% and -75%, respectively, with natural gas and SPY.
Murphy Oil’s production mix contains ~55% crude oil, and so crude oil prices have a high influence on MUR’s stock price.
For more on the correlations of upstream stocks with energy commodities, check out Market Realist’s series How Correlations with Energy Commodities Impact Upstream Stocks.
