How the Inventory Spread Could Boost Natural Gas Prices
In the week ended October 6, natural gas inventories rose by 87 Bcf (billion cubic feet) to 3,595 Bcf—13 Bcf more than the market expected inventories to rise.
Nov. 20 2020, Updated 5:19 p.m. ET

Natural gas inventory data
In the week ended October 6, 2017, natural gas inventories rose by 87 Bcf (billion cubic feet) to 3,595 Bcf—13 Bcf more than the market expected inventories to rise. But on October 12, 2017, natural gas (FCG) prices rose 3.5%, after the EIA (US Energy Information Administration) released its inventory data.
Inventory spread
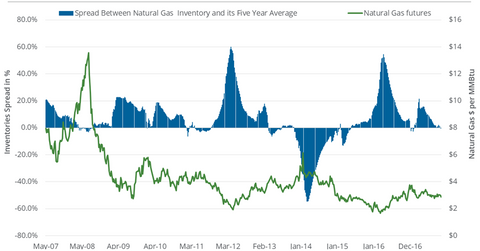
The difference between natural gas inventories and their five-year average is referred to as the “inventory spread.” Any rise in the inventory spread can pull natural gas prices down, and vice versa.
For example, in the week ended March 4, 2016, natural gas prices touched their 17-year low. The inventory level was 41.5% above its five-year average during the same week.
In the week ended October 6, 2017, the inventory spread was at -0.2%—in the negative territory only for the second time since the week ended January 27, 2017. This could have been behind the upside in natural gas prices on October 12, 2017, but between October 12–18, 2017, bearish weather data could have caused the 4.5% fall in natural gas prices.
Market forecast
Last week (ended October 13), natural gas inventories could have risen by as much as 59 Bcf. During the same time period last year, natural gas inventories rose by 77 Bcf. The EIA will release its latest natural gas inventory report on October 19, 2017.
Any rise below ~79 Bcf would still push the inventory spread further into negative territory, and any rise below 86 Bcf would still ensure that the reversal in the inventory spread continues.
However, further expansion in the negative inventory spread might not boost natural gas-weighted stocks like WPX Energy (WPX) and Chesapeake Energy (CHK), based on their correlations with natural gas prices. Similarly, equity indexes like the S&P 500 Index (SPY) and the Dow Jones Industrial Average Index (DIA) may be indifferent to the changes in the natural gas inventory spread.
