The Dollar Index and Economic Uncertainty: Is There Correlation?
The rally in the US Dollar Index can be correlated to two important events: the dot-com bubble crisis in 1999 and the Argentine debt crisis in 2001.
July 22 2016, Updated 1:10 p.m. ET

The performance of the dollar index between 1996 and 2005
Between 1996 and 2005, the US Dollar Index (UUP) rallied by ~8.1%. The rally in the US Dollar Index can be correlated to two important events: the dot-com bubble crisis in 1999 and the Argentine debt crisis in 2001.
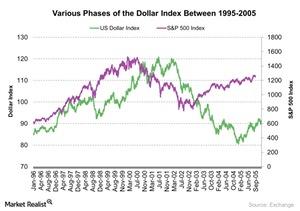
The graph above shows the movement of the dollar index during the different macroeconomic events between 1996 and 2005.
Dollar index movements during Argentina’s debt crisis
The rally in the US Dollar Index (UUP) between 2001 and 2002 can be correlated to the Argentine debt crisis. Argentina defaulted on an $82 billion bond repayment in December 2001. Between 2001 and 2002, the dollar index touched a high of 120.9 on July 5, 2001, based on closing price.
In 1999, when the dot-com bubble crisis was slowly affecting the performance of the S&P 500 Index (SPY), the dollar index showed a positive performance. It rose by nearly 14% from September 1999 to April 2001. However, it showed the opposite performance after 2002, falling by nearly 33% from February 2002 to May 2005.
The index gave a boost to the commodity market, as commodities are valued in US dollar–denominated assets. Rising demand in emerging markets (EDC) (EEM) (EMB) also helped commodities (DBC) to rally at the time.
Why the dollar index measures the degree of economic uncertainty
The strengthening of the US Dollar Index can be correlated to one important factor: During times of economic uncertainty, investors find US fixed-income securities (BND) (AGG) more attractive, strengthening the US Dollar Index.
In the next part of this series, we’ll analyze the performance of the 2-Year and 10-Year Treasury yields from 2006 to 2016.
