Will IEP Maintain Its Record of Delivering Superior Returns?
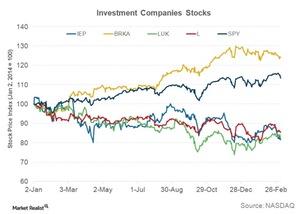
Icahn Enterprises’ (IEP) stock price corrected by 33% from April 20, 2015, to April 20, 2016. On April 15, 2016, the company was trading at $61.3.
Nov. 20 2020, Updated 3:22 p.m. ET

Icahn Enterprises’ stock movement
Icahn Enterprises’ (IEP) stock price corrected by 33% from April 20, 2015, to April 20, 2016. On April 15, 2016, the company was trading at $61.3.
IEP’s stock price has been impacted by the bumpiness in the oil and gas (XOP) sector and weak industrials (XLI). IEP has exposure to ten operating segments, and it’s undergoing restructuring wherever essential.
As seen in the graph above, Berkshire Hathway (BRK-B) has clearly outperformed Leucadia (LUK), Loews (L), and Icahn Enterprises.
In 2015, both Leucadia’s and Loews’ revenues fell compared to their revenues in 2014. They fell by 5% and 6%, respectively. Berkshire’s revenue rose by 5% in 2015 compared to 2014.
Icahn Enterprises’ history of superior returns
Until June 30, 2015, IEP outperformed Berkshire, Leucadia, Loews, the S&P 500, the Dow Jones Industrial Average, and the Russell 2000 Index.
In this weak and challenging environment, IEP’s growth and profitability have dampened. On a year-to-date basis, IEP’s stock has fallen 33% compared to the 1% fall of the SPDR S&P 500 ETF (SPY). How IEP progresses fundamentally will determine its future stock returns.
IEP makes up part of the Global X SuperDividend U.S. ETF (DIV). Investors will benefit if IEP shows a strong operating performance in 2016 and continues to pay dividends.
ClubCorp Holdings (MYCC), Covanta Holding (CVA), and CONE Midstream Partners (CNXX) are among the top ten holdings of DIV. They account for 2.4%, 2.3%, and 2.2% of its portfolio, respectively.
Continue to the next part of the series to understand the factors behind Icahn’s revenue fall.
