Restructuring Frontline’s Balance Sheet
Fontline’s balance sheet restructuring has improved its solvency ratios.
By Sue Goodridge
Sept. 15 2015, Updated 9:30 a.m. ET

High leverage
Crude (DBO) tanker companies such as Teekay Tankers (TNK), Nordic American Tanker (NAT), Tsakos Energy Navigation (TNP), DHT Holdings (DHT), and Euronav (EURN) are highly leveraged. Frontline (FRO), one of the most levered companies in 2Q15, has changed its capital structure to strengthen its balance sheet.
Article continues below advertisement
Equity issuance
- In 2Q15, Frontline (FRO) issued 18.8 million new shares. Its existing ATM (at-the-market) program is now fully utilized.
- Issuing equity strengthens the balance sheet of the company but also dilutes the ownership percentage, voting control, and dividend and earnings per share. More positively, issuing equity reduces financial leverage and future volatility of the stock.
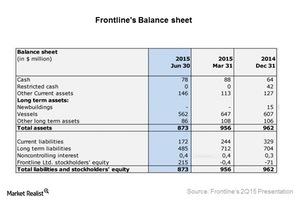
- Frontline’s total equity increased by $218 million this quarter.
Liabilities and assets
- The company repaid an outstanding balance of $94.3 million on its convertible bond in April upon its maturity. The company considers this an important milestone, as it was concerned about the bond’s maturity.
- The company’s cash balance has reduced by $10 million, which was used towards the repayment of the bond.
- After the company’s renegotiation with Ship Finance, its vessel and equipment liabilities decreased by $85 million. In the next article, we’ll examine Frontline’s charter structure with Ship Finance in greater detail.
- Frontline’s long-term debt has decreased by $321 million.
Balance sheet ratios
- Fontline’s balance sheet restructuring has improved its solvency ratios. The company’s liquidity position has strengthened. Liquidity ratio, calculated as current assets divided by current liabilities, has increased from 0.82 at the end of 1Q15 to 1.3 at the end of 2Q15.
- The company’s solvency ratio, calculated as total debt divided by total assets, has decreased significantly from 93% in 1Q15 to 63% in 2Q15. This implies that as of March 2015, 93% of total assets were financed by debt, whereas in June 2015, only 63% of total assets were financed by debt.
- The debt coverage ratio given by net debt-to-EBITDA (earnings before interest, taxes, depreciation, and amortization) has decreased from 14.2 in 1Q15 to 9.7 in 2Q15. This implies that earlier it would have taken Frontline around 14 years to repay its debt if net debt and EBITDA were to stay constant. Now, if net debt and EBITDA stay constant, it will take nine years for Frontline to repay its debt.
