Morgan Stanley’s Careful Attention to Compensation Expenses
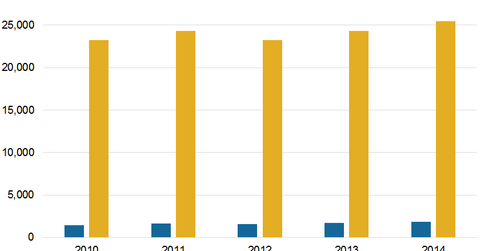
Morgan Stanley divides its non-interest expenses into compensation and non-compensation. It’s compensation expenses (and benefits) are ~80% of this class.
Sept. 17 2015, Updated 9:07 a.m. ET

Major Expenses
Morgan Stanley (MS) classifies its non-interest expenses into compensation and benefits expenses and non-compensation expenses. It’s compensation and benefit expenses form approximately 80% of its total non-interest expenses.
Compensation expenses
Morgan Stanely’s compensation and benefits expenses include the following:
- accrual for base salaries
- fixed allowances
- discretionary incentive compensation
- incentive programs
- amortization of deferred cash and equity awards
- changes in fair value of deferred compensation
- other expenses like health and welfare benefits
The company’s employees in its Wealth Management division, which engages in generating returns for clients, may also receive incentive-based compensation based on individual as well as company-wide performance.
Morgan Stanley has also approved a discretionary incentive compensation, which would reduce the average deferral of the approved incentive-based compensation or awards in a form of cash or equity by almost 50%.
Morgan Stanley’s business strategy aims for greater financial stability. As a result, the company has put itself in a strong position to alter its level of deferrals, which would lead to an existing practice more consistent with the deferral levels of global competitors like Goldman Sachs (GS), Citigroup (C), and Bank of America Corporation (BAC).
Non-compensation expense
Morgan Stanley’s non-compensation expenses include technology, administration, operational, legal, and other miscellaneous expenditures. Its overall expenses have declined over the past few quarters, reflecting the company’s focus on maintaining higher margins. The company concentrates on both compensation as well as non-compensation expenses in order to increase its efficiency and profitability.
Morgan Stanley’s net profit margins for the past 12 months stood at 9.7%. Here’s how its peers compare:
- Goldman Sachs Group (GS) saw a net profit margin of 21.15%.
- JPMorgan Chase (JPM) saw a net profit margin of 23.1%.
- Bank of America Corporation (BAC) saw a net profit margin of 5.7%.
- Wells Fargo & Company (WFC) saw a net profit margin of 28.0%.
Together, these banks account for approximately 28% of the Financial Select Sector SPDR Fund (XLF).
For a look at Morgan Stanley’s growth over the past few years, check out the next part of this series.
