Improving Capacity Utilization Adds to Airline Profitability
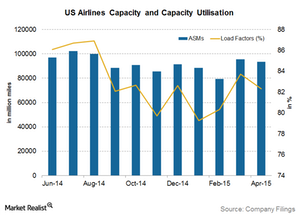
Capacity utilization has improved from the lows of ~57% in the 1970s to ~76% in 2014 and 81.88% in year-to-date 2015.
June 23 2015, Updated 11:07 a.m. ET

Load factor
Airline capacity utilization is measured by load factor and indicates the percentage of total capacity that is utilized by an airline. Airline capacity utilization is calculated by dividing revenue passenger miles (or RPM) with available seat miles (or ASM). Since airlines are capital intensive and have high fixed costs, the efficiency with which they utilize their assets is the key to generating adequate return on investment.
The higher an airline’s load factor is, the higher the revenues and profitability can be for the airline. As the load factor increases, the fixed costs are spread out among more paying passengers. Combined, ASM and load factor are responsible for the growth in an airline’s RPM.
Current capacity utilization
Currently, passenger load factors are at one of the highest levels seen in the industry. Load factor increased to 83.82% in May 2015, compared with 82.30% in April 2015 and 83.70% in March 2015. Year-to-date load factors have averaged 81.88%.
However, cargo load factors are at the lowest seen in the last 12 months, mainly due to the mismatch in supply and demand.
Load factors of major US airlines
Some US airlines also reported a growth in their load factors. Southwest Airlines’ (LUV) load factor increased to 84.4% in May 2015, compared with 83.7% in May 2014. The load factor for JetBlue (JBLU) increased from 85.2% in May 2014 to 85.7% in May 2015.
The load factor for Delta Air Lines (DAL) decreased to 85.4% in May 2015, compared with 86.5% in May 2014. American Airlines (AAL) reported a 1.2% drop in its load factor to 82.8% in May 2015. Alaska Airlines’ (ALK) load factor also decreased by 1.2% to 84.5%.
These airlines are part of a variety of ETFs, including the iShares Transportation Average ETF (IYT), with 38% of its holdings in airline stocks. Also, the PowerShares DWA Consumer Cyclicals Momentum Portfolio ETF (PEZ) has 5.59% of its holdings in airline stocks.
Historical trend
The cost of running an airline has increased tremendously over the years, given the ever-increasing rate of inflation and a substantial rise in fuel prices. However, intense competition and price wars have seen to the fact that airfare growth has not kept pace with the rise in costs.
Declining revenues and increasing costs mean declining profits. Airlines were forced to increase capacity utilization in order to remain profitable. Even in 2014, US airlines had to fill three out of every four seats to remain profitable.
As shown in the chart above, capacity utilization has improved from the lows of ~57% in the 1970s to ~76% in 2014 and 81.88% in year-to-date 2015. Improving capacity utilization, together with cost cutting and falling fuel prices, have made most US airlines profitable.
