PowerShares DWA Cnsmr Cyclicals Mom ETF
Latest PowerShares DWA Cnsmr Cyclicals Mom ETF News and Updates
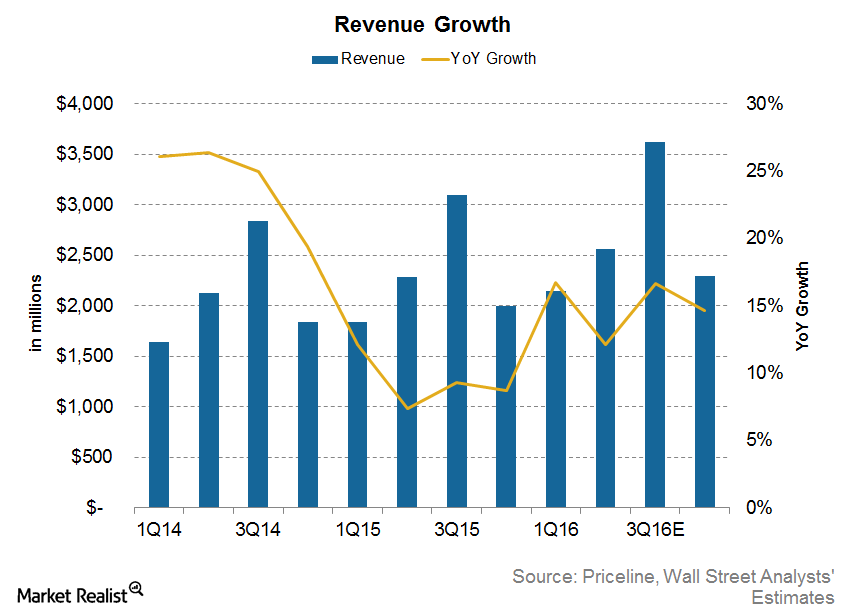
Will Market Share Gains Continue to Drive Priceline’s Revenue Growth in 2016?
For 3Q16, analysts are estimating Priceline’s revenues to grow by 16.6%, which would be higher than the 12% growth the company saw in the second quarter.
Overview of Nike Earnings, Leverage, and Valuation
Nike (NKE) has a positive earnings surprise history. In simple terms, the company has beat Wall Street’s earnings estimates in the past several quarters.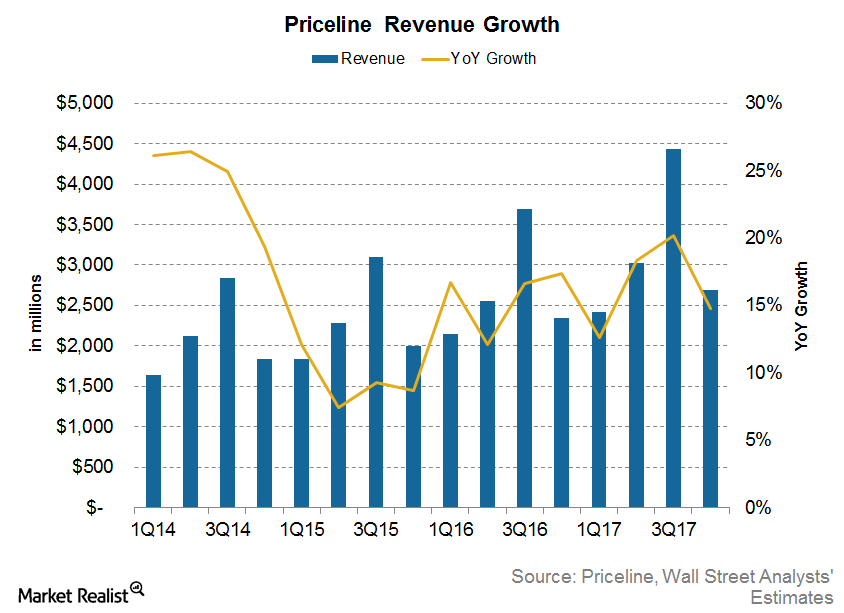
What Analysts Estimate for Priceline in 4Q17
After Priceline (PCLN) released its 3Q17 results, analysts’ estimates for 2017 and 2018 were revised downwards. For the fourth quarter of 2017, sales are expected to grow 14.8% year-over-year or YoY to $2.7 billion.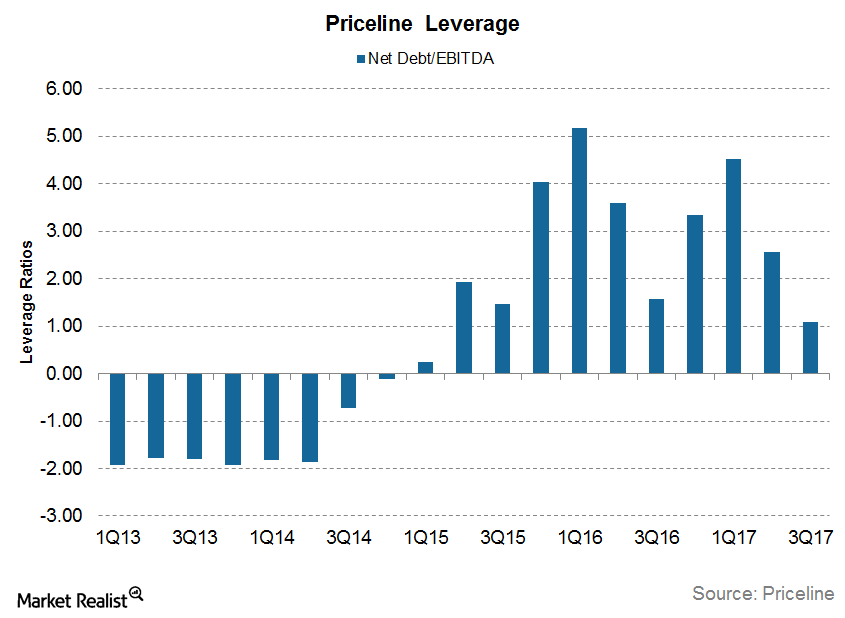
Priceline’s Increasing Leverage: What You Need to Know
A large part of Priceline’s (PCLN) growth in the past has come from acquiring smaller companies all over the world. It had to raise debt to finance some of these acquisitions.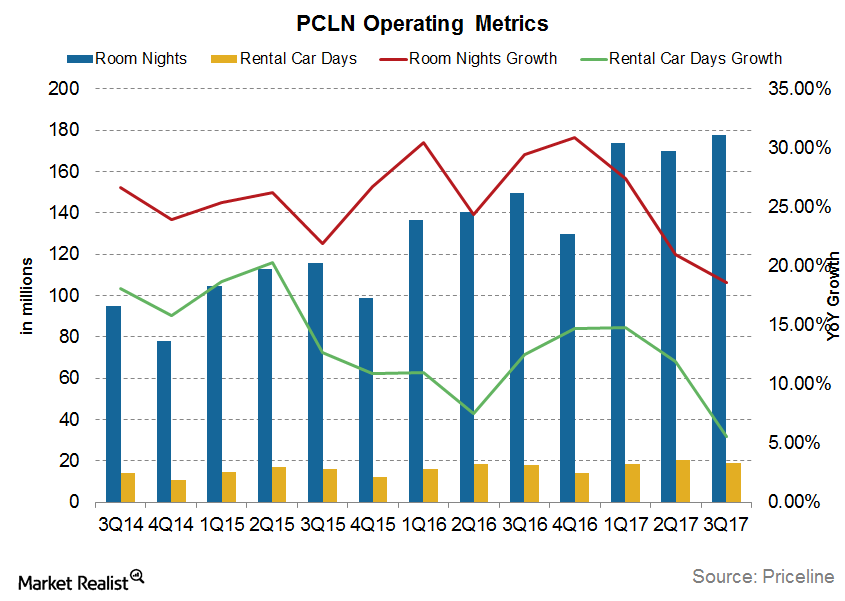
Priceline’s Key Metric Growth Is Slowing Down
Hotel accommodations have historically driven Priceline’s growth. During the third quarter of the year, Priceline’s global accommodation business booked 178 million room nights.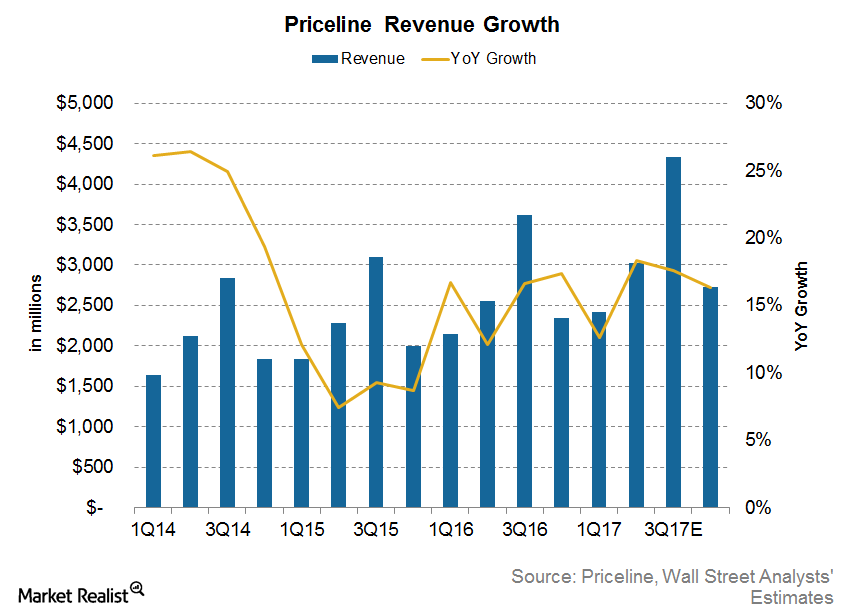
Assessing Priceline’s Revenue Growth in 2017
Analysts expect Priceline’s fiscal 2017 revenues to grow 16.7% YoY to $12.5 billion, which is slightly lower than the 16.5% YoY growth seen in 2016.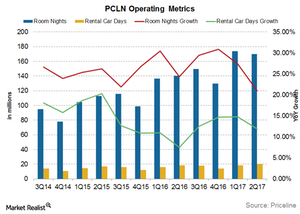
Chart in Focus: Priceline’s Booking Guidance for 3Q17
In 2Q17, Priceline’s (PCLN) gross bookings grew 16.4% year-over-year to $20.8 billion.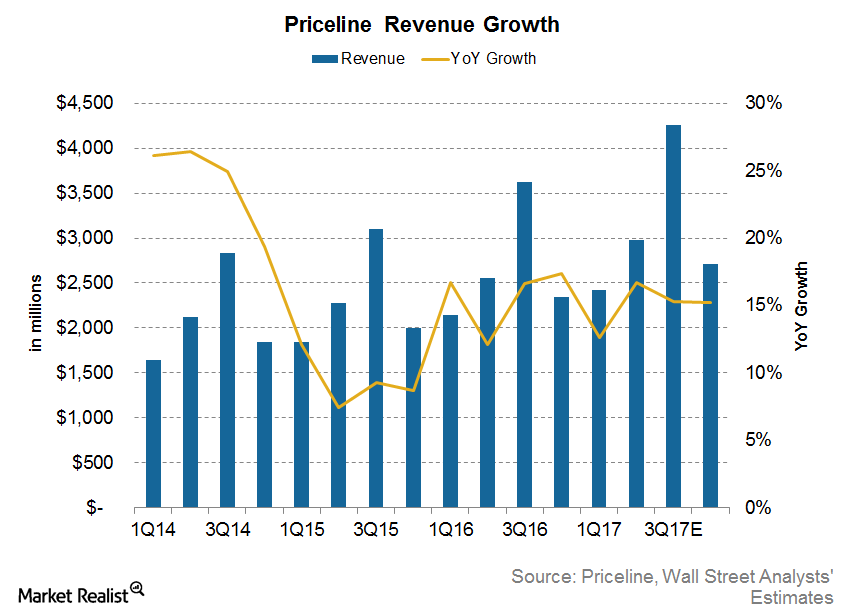
How Priceline Can Grow Its Revenue in 2017
For 2Q17, analysts are estimating that Priceline’s (PCLN) revenue will rise 16.7% YoY to $3.0 billion, which is higher than 12.6% in 1Q17.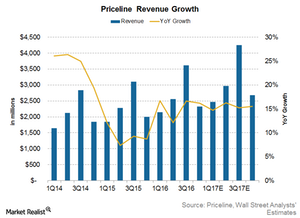
How Market Share Gains Can Boost Priceline’s Revenue Growth Rate
Priceline’s (PCLN) fiscal 2016 performance was subdued by the dollar’s appreciation. Because Priceline has a widespread international presence, it’s prone to currency fluctuation risks.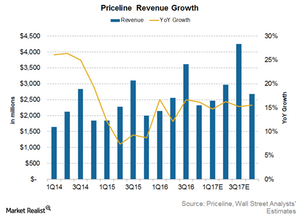
Will Market Share Gains Continue to Drive PCLN’s Revenue Growth?
For 4Q16, analysts expect Priceline’s (PCLN) revenue to rise 16.2%, less than the 18.9% growth the company saw in 3Q16.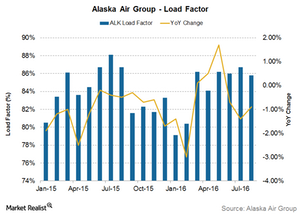
Will Alaska Air’s Unit Revenues Continue to Fall in September?
Foreign currency fluctuations and lower fuel surcharges in the international market will have a negative impact on Alaska Air Group’s unit revenues.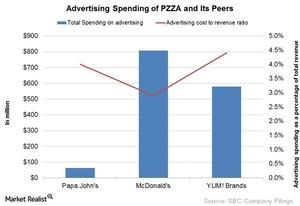
Papa John’s Marketing and Promotional Strategies: What’s in the Oven?
In 2014, Papa John’s spent $63 million, or 4% of its total revenues, on advertising, whereas McDonald’s spent $808 million, or 2.9% of its total revenues.