Uncertain Times for the Crude Oil Market: Neutral Doji Pattern
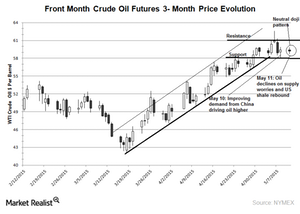
June WTI crude oil futures showed the neutral doji pattern on May 9. Oil prices are swinging due to the frequent change in supply and demand dynamics.
Nov. 20 2020, Updated 2:46 p.m. ET

Neutral doji pattern
June WTI (West Texas Intermediate) crude oil futures showed the neutral doji pattern on May 9, 2015. Massive production from OPEC, Russia, and the US shale recovery will put more pressure on oil prices. Oil prices are swinging due to the frequent change in supply and demand dynamics. The key catalyst would be the EIA’s (U.S. Energy Information Administration) inventory report. It will be released tomorrow.
Key pivots
Crude oil prices are moving towards the support of $58 per barrel. Oversupply worries and the massive production consensus are driving oil prices lower. Prices hit this mark multiple times in April 2015. In contrast, the improved demand outlook from China would drive oil prices higher. The key resistance is seen at $66 per barrel. Prices hit this level in May 2009. The declining US inventories could support oil prices.
The neutral doji candlestick pattern is a trend reversal pattern. This pattern forms when buying and selling activity is at equilibrium. This shows that oil prices could reverse. To learn more about candlestick patterns, read An Investor’s Guide to Candlestick Patterns.
Likewise, the RSI (relative strength index) is in overbought territory. Crude oil prices could fall from these levels. WTI oil futures’ contract volume for June and July is below the five-day average volume and above the ten-day average volume, respectively.
The decline in oil prices impacts ETFs like the VelocityShares 3X Long Crude ETN (UWTI). However, it’s positive for ETFs like the ProShares Ultrashort Bloomberg Crude Oil (SCO).
Lower oil prices are also negative for crude oil producers like Bill Barrett (BBG), Bonanza Creek Energy (BCEI), and RSP Permian (RSPP). They account for 4.78% of the SPDR Oil and Gas ETF (XOP). These upstream players have a crude oil production mix that’s more than 46% of their total production.
For the latest updates, visit Market Realist’s Crude Oil ETFs page.
