What Drives Generic Pharmaceuticals’ Valuation?
Valuation reflects the market’s perceptions of the industry’s growth prospects. The major value drivers for valuation are ROIC and the growth rate.
March 28 2015, Updated 3:05 a.m. ET

Understanding valuation
Valuation reflects the market’s perceptions of the industry’s growth prospects. In this part of the series, we’ll discuss the relevant valuation metrics for the generics industry.
The relevant valuation metrics include:
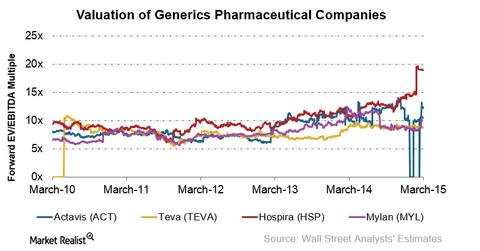
- EV/EBITDA (enterprise value to earnings before interest, tax, depreciation, and amortization) and EBIT – EBITDA is a proxy for free cash flows. However, it doesn’t cover the variations in capital expenditure and depreciation. That’s why the EBIT multiple should also be used for the valuation of capital-intensive companies. Hospira (HSP) has the highest forward multiple. It’s followed by Actavis (ACT), Mylan (MYL), and Teva (TEVA). Please refer to the above chart.
- Free cash flow yield – This is calculated by dividing free cash flow by market capitalization. In general, a higher ratio would mean that the industry is attractive. The yield declined from 3.1x in 2001 to 1.2x in 2014. There are declining prices and shrinking margins due to product commoditization.
- P/E (price-to-earnings) ratio – The higher P/E ratio would mean that the market is ready to pay a higher price for current earnings. This ratio increased from 22.8x in 2013 to 40.1x in 2014. It reflects positive market sentiments for the industry.
- PEG (price-to-earnings-to-growth) ratio – This is calculated by dividing prospective P/E by the average forecasted earnings growth rate. This is highly dependent on the forward growth rate. The forward growth rate depends on factors—like total ANDA (Abbreviated New Drug Applications) filed and product pipeline. For global generics, the PEG ratio rose from 1x in 2011 to 2x in 2014.
What drives valuation?
The major value drivers for valuation are ROIC (return on invested capital) and the growth rate. ROIC is the function of revenue, growth, and margins. Improved margins result in improved ROIC—provided that the invested capital remains same. To create value, the industry’s ROIC should exceed the cost of capital.
Revenue, growth, and margins are impacted by the key performance metrics. The performance metrics include:
- research and development, or R&D, expense—as a percentage of sales—to develop differentiated products with higher margins
- number of generic drugs released
- product pipeline
- number of ANDAs filed and ANDAs with market exclusivity
- production cost
The industry’s attractiveness can be monetized through pharmaceutical ETFs—like the S&P Health Care Select Sector Index (XLV) and the First Trust Health Care AlphaDEX Fund (FXH).
