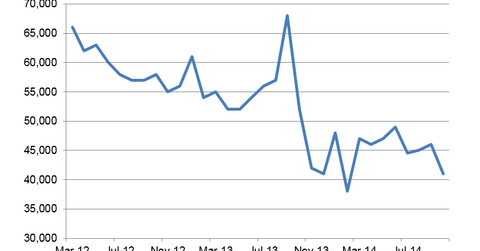
Foreclosure Completions Drop In October
Since foreclosures represent a process that may or may not wind up with the bank owning the home, foreclosure completions are a better indicator of foreclosure activity than foreclosure starts.
Dec. 4 2020, Updated 10:52 a.m. ET

Foreclosure completions increased in September
Investors, realtors, and homebuilders watch foreclosure activity closely because it forecasts future housing supply. Foreclosure timelines can vary widely by state, depending on whether a foreclosure needs approval by a judge. The large foreclosure pipeline in the judicial states is one reason prices are still languishing in the Northeast. Homebuyers don’t focus just on existing supply. They also focus on projected supply.
Increases in foreclosure activity correlate with lower home prices because distressed properties tend to trade at a discount to non-distressed properties. Foreclosure sales prices are typically 15% to 20% lower than non-distressed prices. Short sales tend to trade at smaller discounts, closer to 15%.
These factors lower comparable sales prices (or comps), which in turn lower appraisals and the value of neighboring properties. Low appraisal values are an issue right now for a lot of borrowers, especially those that are using low down payment Federal Housing Administration (or FHA) and Veterans Affairs (or VA) loans. If the appraisal comes in lower than the sales price, the borrower must have a down payment or forgo the sale.
So, there are many ripple effects from foreclosures.
Foreclosure completions decreased in October
Foreclosure completions decreased by 5,000 units to 41,000, according to CoreLogic. Completions are down 34% year-over-year. That said, 41,000 is still a relatively elevated number. From 2000 to 2006, foreclosure completions averaged around 21,000 a month.
Since foreclosures represent a process that may or may not wind up with the bank owning the home, foreclosure completions are a better indicator of foreclosure activity than foreclosure starts.
Total foreclosure inventory is down 34% from a year ago.
Implications for homebuilders
Homebuilders like Lennar Corporation (LEN), D.R. Horton, Inc. (DHI), PulteGroup, Inc. (PHM), and Toll Brothers Inc. (TOL) compete with existing homes for sales. Foreclosure activity can act as a damper on the local housing market as buyers anticipate lower prices. You should focus on the builders with exposure to markets where foreclosure activity has been muted.
Investors who are interested in trading the housing sector as a whole should look at the SPDR S&P Homebuilders (XHB) exchange-traded fund (or ETF).
