Analyzing India’s oil consumption
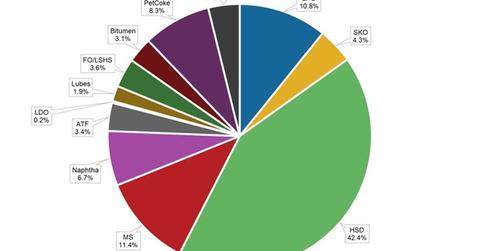
In India, the consumption of oil products saw steady growth over the years. The CAGR (compound annual growth rate) for the ten years ending in March 2014 is above 3.5%.
Dec. 31 2014, Updated 9:07 a.m. ET

Historical trend
In India, the consumption of oil products saw steady growth over the years. The CAGR (compound annual growth rate) for the ten years ending in March 2014 is above 3.5%. There has been growth across the three categories:
- Sensitive products
- Major decontrolled products
- Other minor decontrolled products
In terms of annual growth, other minor decontrolled products is the most volatile category. In this category, the consumption of products fell by over 20% in fiscal year 2011 year-over-year, or YoY. It saw a surge of over 41% in fiscal year 2013.
The other two categories saw a fall in consumption in fiscal year 2014. Consumption of sensitive products fell by 0.4%. Consumption of major decontrolled products fell by 0.7%.
Current trend
Despite the minor fall in the previous year, the growth trend is continuing this year. Overall growth is 3.7%—compared to the same period last year. The data for fiscal year 2015 is from April to November 2014. Sensitive products have been consumed by over 2.6% this year. Major decontrolled products’ consumption increased by 2.1%. Other minor decontrolled products’ usage increased 13.8%.
World trend
According to IES (International Energy Statistics) presented by the EIA (US Energy Information Administration), the CAGR for total petroleum consumption for the world was 0.8% from 2005 to 2013. This consumption has been measured in thousand barrels per day. In the same period, China saw its consumption increase by 5.1%. In CAGR terms, India’s consumption increased by 4.1%. In contrast, the US saw its consumption decrease by 1.2%.
This shows that India hasn’t been plagued by a demand reduction. Its demand remains higher than the world’s demand. This is important to know. If India’s demand had fallen, like the US, then analyzing the impact of a fall in crude oil price wouldn’t mean much.
This year, the fall was negative for energy ETFs—the like Energy Select Sector SPDR Fund (XLE), the VanEck Vectors Oil Services ETF (OIH), and the SPDR S&P Oil & Gas Exploration & Production ETF (XOP). However, Indian ETFs—like the WisdomTree India Earnings Fund (EPI) and the PowerShares India Portfolio (PIN)—that have significant exposure to India’s energy sector, would have seen a limited impact.
In the next part of this series, we’ll discuss petroleum production in India.
