Why technical analysis uses price patterns
Price patterns are trends that occur in stock charts. The charts are used in technical analysis. The pattern forms recognizable shapes. Price patterns are used to forecast the prices.
Nov. 27 2019, Updated 4:28 p.m. ET

Price patterns
Price patterns are trends that occur in stock charts. The charts are used in technical analysis. The patterns form recognizable shapes. The most common patterns repeat. Price patterns are used to forecast the prices.
Patterns are formed because of market participants’ behavior. The stock price changes because of investors’ collective trading actions. The price changes are recorded. They’re shown as shapes.
Pattern formation trends are also important. The patterns and trends are combined to analyze the stocks.
Types of price patterns
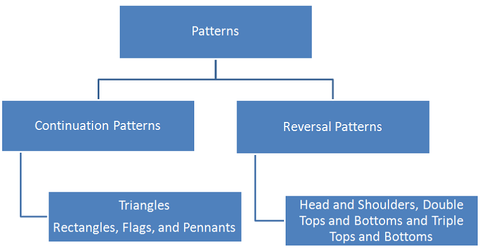
Price patterns are separated into continuation patterns and reversal patterns.
A pattern that continues its trend in the direction of a major trend—even after the pattern breakout—is called a continuation pattern. Continuation patterns are formed because investors think the price may not increase more in an uptrend or decrease more in a downtrend. As a result, they start selling the stock. The selling and buying activity causes a consolidation in the stock. This results in the respective price patterns.
Reversal patterns are a major trend’s reversal patterns. The pattern is formed at the peak or at the bottom of a major trend. Reversal patterns are formed because the perception of the stock in the market changes. The investors think the fundamentals are changing at the peak of an uptrend and at the bottom of a downtrend. This selling and buying activity causes a consolidation in the stock. This results in price patterns.
Predicting the pattern breakout or breakup direction helps identify the original trend direction. This is used to forecast price movements.
Applying pattern concepts
In technical analysis, the price pattern concept can be applied to companies like Range Resources (RRC), Chesapeake Energy (CHK), SM Energy (SM), and Linn Energy (LINE). These companies are part of energy exchange-traded funds (or ETFs) like the Vanguard Energy ETF (VDE) and the SPDR S&P Oil & Gas Exploration & Production ETF.
