Linn Energy LLC
Most Recent
Company & Industry OverviewsBehind Chesapeake Energy’s Stock Reaction after Debt Swap Announcement
After its debt swap announcement, CHK’s stock initially spiked to $4.63 on May 12, 2016, but closed at $4.17, down 4.3% compared to the previous close.
MiscellaneousWill Breitburn Energy Partners Follow Linn Energy?
Breitburn Energy Partners is going through a liquidity crisis. It expects the borrowing base under its credit facility to be redetermined in late May 2016.
MiscellaneousWhy Did Linn Energy File for Bankruptcy Protection?
Linn Energy (LINE) and LinnCo LLC (LNCO) filed for protection under Chapter 11 of the Bankruptcy Code on Wednesday, May 11.
Company & Industry OverviewsWhat Does Vanguard Natural’s Valuation Mean for Investors?
Vanguard Natural Resources is currently trading at a price-to-distributable cash flow of 1.5x.
Company & Industry OverviewsVanguard Natural Resources’ 2016 Capex to Decline by 45%: Why?
Vanguard Natural Resources’ (VNR) distributable cash flow fell to $164.3 million in 2015 from $214.8 million in 2014, a decline of 23.5%.
Company & Industry OverviewsHow Does Vanguard Natural Resources’ Hedging Program Compare?
Vanguard Natural Resources gained $169.4 million from commodity derivative contracts in 2015.
Macroeconomic AnalysisWhy a 0.3% Rise in Crude Oil Inventories Impacted MLPs
According to data released on March 16, 2016, US crude oil inventories rose 0.3% in the week ending March 11, 2016.
Earnings ReportLinn Energy One Step Away from Chapter 11 Bankruptcy Filing
Linn Energy (LINE) is among several upstream producers plagued by the extended low commodity price environment and high leverage. LINE has a huge outstanding debt of ~$10 billion sitting on its balance sheet.
MiscellaneousUpstream Companies’ Leverage: Why It’s a Concern
Many of the smaller upstream companies (XOP) have become highly leveraged. This increases the possibility of a default or bankruptcy.
Earnings ReportWhat Do Analysts Recommend for Breitburn Energy Partners?
At a broader level, 72.7% of the analysts surveyed by Bloomberg rate Breitburn Energy a “hold,” 9.1% rate it a “buy,” and the remaining ~18.2% rate it a “sell.”
Earnings ReportAnalysts’ Ratings for Vanguard Natural before Its 4Q15 Results
At a broader level, 60% of analysts surveyed by Bloomberg rate Vanguard Natural Resources a “hold,” 30% rate it as a “buy,” and the remaining ~10% rate it a “sell.”
Company & Industry OverviewsAre Skyrocketing MLP Distribution Yields Sustainable?
In the midst of a sell-off in the midstream energy sector, many MLPs’ yields skyrocketed.
Macroeconomic AnalysisWhat Happened to the US Natural Gas Rig Count?
In the week ending November 25, there were 189 operating US natural gas rigs. Since the beginning of 2015, the natural gas rigs fell by 139 as of November 25.
Macroeconomic AnalysisMid-Con Energy: Top Upstream MLP Loser on November 19
The top upstream MLP losers include Mid-Con Energy Partners (MCEP), Linn Energy (LINE), Vanguard Natural Resources (VNR), and Atlas Resource Partners (ARP).
Macroeconomic AnalysisLegacy Reserves: Top Upstream MLP Gainer on November 16
The top upstream MLP gainers include Legacy Reserves (LGCY), Linn Energy (LINE), Mid-Con Energy Partners (MCEP), and Vanguard Natural Resources (VNR).
Macroeconomic AnalysisLinn Energy: Top Upstream MLP Loser on November 6
The top upstream MLP losers include Linn Energy (LINE), Legacy Reserves (LGCY), BreitBurn Energy Partners (BBEP), and Mid-Con Energy Partners (MCEP).
Macroeconomic AnalysisMid-Con Energy Partners: Top Upstream MLP Gainer on November 3
The top upstream MLP gainers include Mid-Con Energy Partners (MCEP), Linn Energy (LINE), Legacy Reserves (LGCY), and BreitBurn Energy Partners (BBEP).
Macroeconomic AnalysisEV Energy Partners: Top Upstream MLP Gainer on October 30
The top upstream MLP gainers include EV Energy Partners (EVEP), Linn Energy (LINE), BreitBurn Energy Partners (BBEP), and Legacy Reserves (LGCY).
Macroeconomic AnalysisAlerian MLP ETF Falls on Negative Investor Sentiments
The Alerian MLP ETF, which comprises 23 midstream energy MLPs, fell 2.4% on October 22, 2015, along with the entire midstream sector.
Macroeconomic AnalysisLegacy Reserves: Top Upstream MLP Loser on October 21
The top upstream MLP losers include Legacy Reserves (LGCY), Linn Energy (LINE), Memorial Production Partners (MEMP), and EV Energy Partners (EVEP).
Macroeconomic AnalysisVanguard Natural Resources: Top Upstream MLP Loser on October 15
The top upstream MLP losers include Vanguard Natural Resources (VNR), Linn Energy (LINE), Memorial Production Partners (MEMP), and Legacy Reserves (LGCY).
Macroeconomic AnalysisLinn Energy: Top Upstream MLP Loser on October 7
The top upstream MLP losers include Linn Energy (LINE), Mid-Con Energy Partners (MCEP), Eagle Rock Energy Partners (EROC), and Legacy Reserves (LGCY).
Macroeconomic AnalysisMid-Con Energy Partners: Top Upstream MLP Loser on September 25
The top upstream MLP losers include Mid-Con Energy Partners MCEP (MCEP), Linn Energy (LINE), LRR Energy (LRE), and Atlas Resource Partners (ARP).
Macroeconomic AnalysisLegacy Reserves: Top Upstream MLP Loser on September 22
The top upstream MLP losers include Legacy Reserves (LGCY), Linn Energy (LINE), Mid-Con Energy Partners (MCEP), and BreitBurn Energy Partners (BBEP).
Macroeconomic AnalysisWhy Linn Energy and Memorial Production Fell on Friday
Linn Energy (LINE) and Memorial Production Partners (MEMP) lost 12.80% and 11.14% of their equity value in a single trading session on Friday.
Earnings ReportAnalyst Recommendations: Vanguard Natural Resources the Favorite
The two most recent recommendations are by UBS and Scotia Howard Weil, and they rate LINE “sell” and “sector perform,” with target prices of $2 and $5, respectively.
Earnings ReportLinn Energy’s Operating Results Disappointed in 2Q15
Linn Energy lost $191.2 million on oil and gas derivatives in 2Q15. In 2Q14, the company lost $408.8 million on those derivatives.
Earnings ReportAn Overview of LINN Energy: The Biggest Upstream MLP Loser
During 1Q15, Linn Energy recorded noncash impairment charges of ~$533 million associated with proved oil and natural gas properties.
Macroeconomic AnalysisEagle Rock Energy Partners: Top Upstream MLP Loser on August 19
Top upstream MLP losers include Eagle Rock Energy Partners (EROC), Vanguard Natural Resources (VNR), LRR Energy (LRE), and Linn Energy (LINE).
Macroeconomic AnalysisLinn Energy: Top Upstream MLP Loser on Tuesday, August 11
Upstream companies’ earnings are significantly tied to crude oil and natural gas prices. UNG tracks daily movements in natural gas futures. It rose 0.44% yesterday.
Macroeconomic AnalysisLinn Energy’s Losing Streak Continued on Friday, July 31
Linn Energy’s (LINE) bloodbath continued on Friday with a single day loss of 15.13% as crude oil continued to fall due to excess supply concerns.
Macroeconomic AnalysisUS Rig Counts Decrease Again: What’s the Impact?
According to oilfield service company Baker Hughes (BHI), there were 857 active oil and gas rigs in the United States in the week ended July 17, 2015.
Earnings ReportAnalyzing ExxonMobil’s Production and Realized Price Trends
In both its US and non-US operations, ExxonMobil’s 1Q15 total liquids production increased marginally since a year ago.
Macroeconomic AnalysisUpstream MLPs Fell as Crude Oil Continued to Fall on July 16
We’ll now analyze the performance of energy-related ETFs and upstream MLPs on July 16.
Macroeconomic AnalysisWhat’s the Impact of the Third Weekly US Rig Rise in a Row?
There were 863 active oil and gas rigs in the US in the week ending July 10, 2015, which is one more than in the previous week.
Earnings ReportWeakness Persists in Marathon Oil’s Geographical Operations
In 1Q15, Marathon Oil’s North American exploration and production sales volume increased 33%, compared with an 8% volume decline in its international operations.
Earnings ReportMarathon Oil’s Expected 2Q15 Earnings May Disappoint
Marathon Oil’s 2Q15 adjusted loss per share is expected to be $0.32, a mild improvement over the $0.37 adjusted loss per share in 1Q15.
Macroeconomic AnalysisCrude Oil Rigs Rise: What’s the Impact?
According to Baker Hughes, there were 862 active oil and gas rigs in the US in the week ending July 2—three more than the previous week ending June 26.
Macroeconomic AnalysisNatural Gas Rigs Drive the Turnaround in US Rigs
In the US, there were 228 natural gas rigs operating in the week ending June 26—five more than in the previous week. This was the second week with an addition.
Macroeconomic AnalysisUS Rig Count Finally Turns Around: The Bloodbath Ends
There were 859 active oil and gas rigs in the US in the week ending June 26—two more than the week before. The US rig count rose in December 2014.
Company & Industry OverviewsAnalyzing EOG Resources’ Operating Level Profitability
In 1Q15, EOG Resources’ adjusted EBITDAX fell 58% to $747.7 million from $1.79 billion a quarter ago. Compared to the figure last year, the fall amounted to 68%.
Macroeconomic AnalysisUS Natural Gas Rig Count: Changed Its Course Last Week
In the US, there were 223 natural gas rigs operating in the week ending June 19—two more than the week before. The fall has slowed down in recent weeks.
Macroeconomic AnalysisRig Count Falls by 2: Will It Turn Next Week?
The US rig count experienced an uptrend throughout most of 2014. However, that trend reversed with 28 consecutive weeks of falling rig counts.
Macroeconomic AnalysisIs the Rig Count Decline Finally Slowing Down?
The US rig count experienced an uptrend throughout most of 2014, but that trend reversed with 27 consecutive weeks of falling rig counts.
Macroeconomic AnalysisUS Natural Gas Rig Count Drops by 3 Last Week
The decline in the natural gas rig count slowed down in the past four weeks. Four rigs went offline in the preceding four weeks, and 43 went offline in the four weeks before that.
Macroeconomic Analysis26-Week Fall Takes Rig Count to 12-Year Low Last Week
The US rig count experienced an uptrend in most of 2014. But that trend reversed with 26 consecutive weeks of falling rig counts, hitting the lowest level since January 2003.
Macroeconomic AnalysisUS Rig Count Drops: Hits a 12-Year Low
There were 875 active oil and gas rigs in the US during the week ending May 29, 2015. With last week’s fall, the average four-week US rig count drop was eight.
Macroeconomic AnalysisPlateauing Rig Count Fall: Does It Point to a Turnaround?
With last week’s fall, the US rig count hit its lowest level since June 12, 2009. A fall in the offshore rig count led the week’s figures.
Earnings ReportRSP Permian’s 1Q15 Production Surges, But Short of Estimates
RSP Permian’s crude oil production increased 98% from 1Q14 to 1Q15, while natural gas production increased 68%. Its natural gas liquids production increased 48% during the same period.
Macroeconomic AnalysisNatural Gas Rigs Help Slow Overall Drop in Rig Count Last Week
The rate of decline in the natural gas rig count has slowed in the past four weeks, during which only six rigs went offline.
Earnings ReportEncana’s 1Q15 Production Falls despite Liquids Production Surge
Encana’s (ECA) 1Q15 production decreased compared to production in the same quarter last year. Its overall crude oil equivalent production volume decreased by 20%, down to 430.1 Mboebpd.
Earnings ReportEncana in 1Q15: Adjusted Earnings Exceed Estimates
In 1Q15, adjusted revenues exceeded estimates by ~6%. On average, adjusted revenues have almost matched consensus estimates in the past 13 quarters.
Earnings ReportEncana Posts Net Loss in 1Q15
Encana (ECA) is an independent oil and gas exploration and production company. The company produces oil and gas in resource plays located in the US and Canada.
Macroeconomic AnalysisOil and Gas Rig Count Down 52% in 12 Months
The oil and gas rig count signals how confident producers are about drilling for oil and gas. Falling rig counts indicate a decline in upstream activity.
Earnings ReportContinental Resources’ 1Q15 Earnings Exceeded Estimates
Between 1Q12–1Q15, Continental Resources’ adjusted revenues increased 13%. From 1Q14–1Q15, the company’s adjusted revenues decreased 37%.
Earnings ReportWall Street Analyst Recommendations after EOG Resources’ Earnings
Approximately 69% of analysts tracking EOG Resources rate it a “buy,” ~21% of these analysts rate the company a “hold,” and 10% of these analysts recommend a “sell.”
Earnings ReportEOG Resources’ Plans for 2015
EOG estimates its realized crude oil price to remain below the West Texas Intermediate price and its natural gas price to remain below the Henry Hub price in 2015.
Earnings ReportEOG Share Price Decreased after 1Q15 Earnings
In 1Q15, EOG’s adjusted earnings exceeded estimates by 233%. On average, adjusted EPS exceeded consensus EPS by ~13% in the past 13 quarters.
Macroeconomic AnalysisOil and Gas Rig Count Drops and Takes Total US Count Down
In the last 12 months to May 1, the total US crude oil and natural gas rig count dropped by 949, or 51%. The number of active oil rigs decreased by 848, or 56%.
Macroeconomic AnalysisWhy the rise in US crude oil production remains unabated
From January 2009 to September 2014, US crude oil production increased 67%, and crude oil production in the seven major shale plays increased 258%.
Energy & Utilities Why the triple top and triple bottom patterns are important
The triple top pattern is formed in the uptrend. In this pattern, three consecutive peaks are formed. The peaks have roughly the same price level.

Financials What are reversal patterns in technical analysis?
The head and shoulder pattern is the most common reversal pattern. It forms at the trend’s peak. The pattern has three peaks—left shoulder, head, and right shoulder.
FinancialsTechnical analysis—the rectangle, flag, and pennant patterns
In the rectangle pattern, it’s advisable to buy stock at support and sell at resistance. This pattern is formed in the uptrend and downtrend.
Energy & Utilities Why the triangle pattern is used for continuation price patterns
The triangle pattern forms because investors think that the stock price won’t go much higher in an uptrend or lower in a downtrend.
FinancialsWhy technical analysis uses price patterns
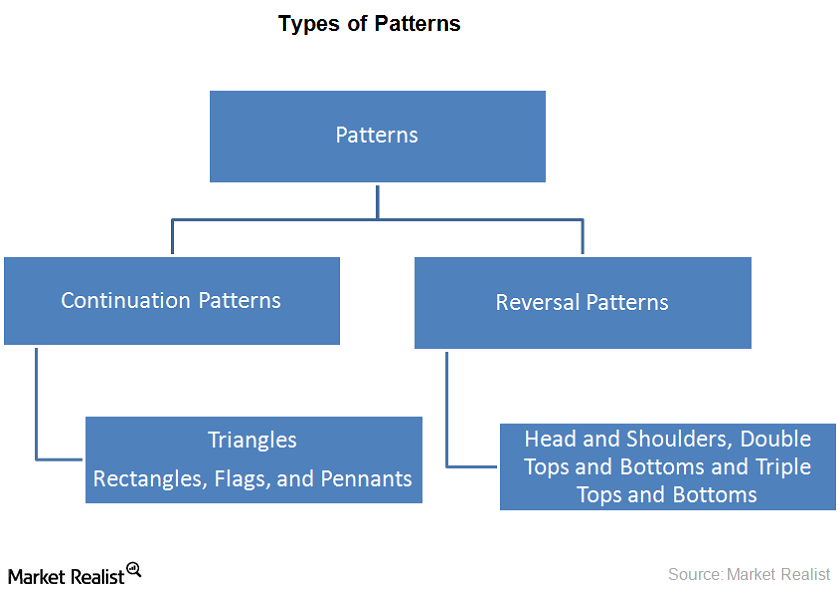
Price patterns are trends that occur in stock charts. The charts are used in technical analysis. The pattern forms recognizable shapes. Price patterns are used to forecast the prices.
Energy & Utilities Why National Fuel Gas is investing in pipeline expansions
As we discussed previously in this series, National Fuel Gas (NFG) noted in its latest fiscal 3Q14 results that its earnings growth was driven by higher earnings in its Midstream and Upstream businesses.
Energy & Utilities Key investment metrics: A financial analysis of LINN Energy
LINE’s EBITDA shows that it has been struggling with its earnings power lately. It has struggled despite a steady rise in its oil and gas production. LINE’s debt exploded from just over $3 billion in 3Q11 to over $9.5 billion in 2Q14.
Energy & Utilities Let’s dive in: An overview of LINN Energy
LINN Energy LLC (LINE) is a U.S. independent oil and natural gas exploration and production company. LINE went public in a 2006 initial public offering (or IPO) that raised ~$261 million.
Energy & Utilities LINN Energy’s stock performance and volatility
LINE hasn’t missed a distribution in the last seven years. The distributions only move in one direction—up. Currently, it pays a monthly distribution of $0.24. It trades at a yield of just under 10%!
Energy & Utilities Deal dynamics: Why the asset swap deals with Exxon are beneficial for LINN Energy
In the four months between May 21 and September 18, LINN Energy (LINE) and ExxonMobil (XOM) entered into two asset swap deals. LINE showcased the deals. They hold many advantages for the company.
Energy & Utilities Must-know: An overview of LINN Energy’s asset swap deal with Exxon
On September 18, LINN Energy LLC (LINE) and ExxonMobil Corp. (XOM) announced a “non-monetary” asset swap deal. The deal involved oil and gas assets in California and Texas.
Energy & UtilitiesA must-know overview of Kinder Morgan Management LLC
Kinder Morgan Management LLC (KMR)—formed in May 2001—is a limited partner in and manager of Kinder Morgan Energy Partners (KMP). So essentially, KMP is run by KMR, which in turn is run by Kinder Morgan Inc (KMI).
Energy & UtilitiesNatural gas liquids prices rise, boosted by propane prices
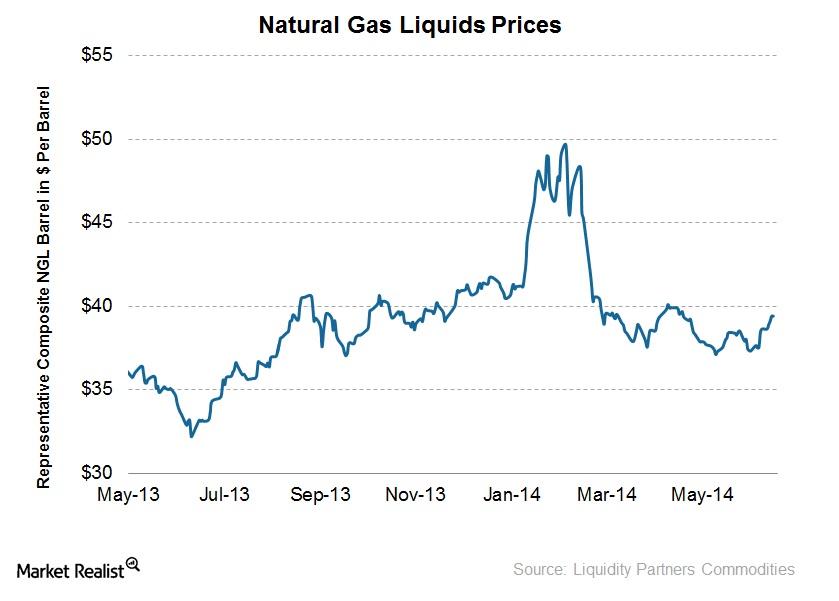
The representative NGL barrel reached highs of up to ~$50 per barrel in early February, given the strength in propane prices due to a cold winter as well as natural gas prices that pushed ethane prices up.
Energy & UtilitiesNatural gas liquids traded higher on ethane and propane prices
This week saw NGL prices trade higher—a positive short-term indicator. Besides, despite falling from highs reached in February, NGL prices remain up significantly since late June 2013.
Energy & UtilitiesThe important effects of higher liquefied petroleum gas exports
The influx of supply of natural gas liquids had caused ethane and propane prices in particular to collapse in late 2012 and early 2013.
Energy & UtilitiesNatural gas liquids prices dipped last week but are up medium-term
NGL prices traded down by 4% on the week, as most of the composition experienced a drop in price. However, the representative NGL barrel remains up over 50% since lows in June.
Energy & UtilitiesHigher natural gas liquids prices: Key causes and beneficiaries
This week saw NGL prices trade up by 5%, a positive short-term indicator. Plus, note that NGL prices are up significantly since late June, a positive medium-term indicator.
Energy & UtilitiesWhy natural gas liquids prices have trended up for 7 months
This week saw NGL prices trade up, a positive short-term indicator. Plus, note that NGL prices are up significantly since late June—a positive medium-term indicator.
Energy & UtilitiesWhy a dip in natural gas liquids prices affects energy names
NGLs prices remain uptrend despite the falling last week, which is positive to producers.
Energy & UtilitiesHigher natural gas liquids prices help wet gas producers like LINE
NGL prices traded higher last week, helping wet gas producers. NGL prices are an important indicator to track in the energy space.
Energy & UtilitiesLow natural gas liquids prices cut into wet gas producer revenues
Natural gas liquids traded down on the week, though they remain up significantly since mid-2013 lows.
Energy & UtilitiesWet gas producers benefit from higher natural gas liquids prices
Natural gas liquids prices increased last week and remain up considerably since mid-year, helping companies with significant wet gas production.
Energy & UtilitiesNatural gas liquids prices fall, hurting wet gas producers
Natural gas liquids prices fell on the week but remain up significantly since lows in June.
Energy & UtilitiesWhat higher natural gas liquids prices mean for the energy sector
Natural gas liquid prices recovered somewhat last week, likely off the back of higher crude oil prices.
Energy & UtilitiesWhy higher oil prices support better natural gas liquids fundamentals
Higher crude oil prices supported NGL prices last week, positively affecting wet gas producers.
Energy & UtilitiesWhich companies are hurt most when NGL prices take a dip?
Natural gas liquids took a leg lower, and are down significantly from the beginning of the year.
Energy & UtilitiesSlightly higher NGL prices benefit wet gas producers such as Linn Energy
Natural gas liquids prices edged higher last week, in a positive for wet gas producers such as Linn Energy.
Energy & UtilitiesNGL prices ended down slightly at $35.64/barrel, negatively affecting wet gas producers
The price on a representative mix of natural gas liquids declined slightly last week, resulting in a negative indicator for wet gas producers.
Energy & UtilitiesNGL prices ended roughly flat at $36.20/barrel in a neutral indicator for wet gas producers
Natural gas liquids prices have remained rangebound, which is a neutral for producers of NGLs.
Energy & UtilitiesNatural gas liquids prices remained roughly flat on the week
Natural gas liquids prices traded roughly flattish on the week in a neutral indicator for upstream energy companies.