How Credit Spreads May React to the Fed’s September Statement
Another rate hike in 2017 The FOMC’s (Federal Open Market Committee) meeting on September 20 changed the outlook for bond markets (BND). It suggested that the Fed could be looking at another rate hike by the end of this year, along with a balance sheet unwinding program. Gains in August inflation (TIP) boosted Fed members’ […]
Sept. 27 2017, Updated 9:13 a.m. ET

Another rate hike in 2017
The FOMC’s (Federal Open Market Committee) meeting on September 20 changed the outlook for bond markets (BND). It suggested that the Fed could be looking at another rate hike by the end of this year, along with a balance sheet unwinding program. Gains in August inflation (TIP) boosted Fed members’ confidence.
Yield spreads
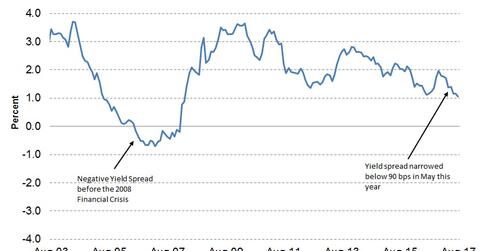
The Conference Board Leading Economic Index (or LEI) uses the interest rate spread between the federal funds rate and ten-year Treasury bonds (IEF) as a constituent of its economic model. The recent LEI indicated that the spread between ten-year Treasury bonds (TBF) and the fed funds rate fell from 1.2 in July to 1.1 in August, suggesting that the index has returned to a downward trend. This yield spread’s net contribution to the LEI fell to 12% in August.
Could yield spreads increase or decrease?
Yield spreads depend on incoming inflation data. If bond (AGG) investor and trader expectations are aligned with the Fed’s, the credit spread is likely to remain at current levels, but if inflation numbers disappoint, yield spreads may decrease, which could lead to an inverted yield curve. An inverted yield curve is considered an early sign of recession. In the next and final part of this series, we’ll look at the only lagging indicator in the LEI.
