Oil Rig Count and Crude Oil Prices: What’s the Correlation?
The US oil rig count reached 652 in the week ended March 24, 2017. That was a 21-rig rise over the previous week.
March 29 2017, Updated 12:06 p.m. ET

Latest oil rig data
The US oil rig count reached 652 in the week ended March 24, 2017. That was a 21-rig rise over the previous week, according to data released by Baker Hughes (BHI). It puts the US oil rig count at its highest level since September 18, 2015.
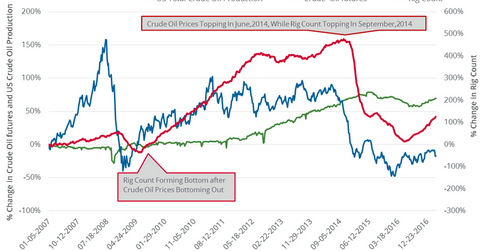
On March 28, 2017, crude oil (DBO) (USL) (OIIL) (SCO) prices were ~54.9% lower than their post-2008 crisis high on June 20, 2014, based on closing prices. Oil prices started on a downturn on June 20, 2014. The number of active oil rigs has fallen 57.2% since then.
US crude oil production is ~5.0% below its peak in June 2015, according to weekly data from the EIA (U.S. Energy Information Administration).
Rig counts and crude oil production
Over the past ten years, the lows and highs of the oil rig count and crude oil have been three to four months apart, according to research by Morgan Stanley. In January 2009, after the subprime housing crisis when crude oil touched multiyear lows, the rig count bottomed out in May 2009.
Crude oil touched a 12-year low on February 11, 2016, but it rebounded 84.5% by March 28, 2017. According to the pattern mentioned above, the rig count should have hit bottom in June 2016.
Rig counts and crude oil prices
In the week ended June 3, 2016, the rig count rose for the first time in 11 weeks. Since the bottom at 316 rigs in the week ended May 27, 2016, the count has risen 336 rigs as of the week ended March 24, 2017. That’s more than double its bottom level.
During that period, crude oil production rose ~4.5%, according to weekly data. It shows the impact of rising rigs on crude oil production. A rising rig count will likely mean more pressure on crude oil prices. It could also impact funds such as the United States Brent Oil ETF (BNO), the Fidelity MSCI Energy ETF (FENY), the Guggenheim S&P 500 Equal Weight Energy ETF (RYE), and the iShares US Oil Equipment & Services (IEZ).
Rig efficiency and oil prices
Increased rig efficiency has been helping US oil companies produce more crude oil with fewer rigs. The EIA estimates that oil production per rig from new wells will be 720 barrels per day in April 2017. That’s about 33.1% higher than in April 2016. This improved efficiency could mean a lot more oil in the future, which doesn’t bode well for oil prices in April 2017.
